Status Report for martinfowler.com at the end 2014
28 January 2015
Running the martinfowler.com site is a large part of my job at Thoughtworks. Traditionally it has got more traffic than our main site, although that is happily set to change as our main site improves. My site is a vehicle for us to influence the industry as part of our pillar 2 work.
One of the nice things about running a website, rather than writing for magazines, is that with analytics data you can get some feedback. It's easy to get too enamored of tracking numbers, but I find it useful to keep an eye on them, primarily to gauge what kind of material gets the most attention.
At the beginning of this year, I decided to spend a bit more time than usual reviewing traffic information so I could better understand what was happening. I took advantage of this effort to share information with our content strategy folks, but I believe in sharing this more widely, so I'm making this available more widely in Thoughtworks too (I may mention it publicly too later on.)
Goals for the site
My primary goal for martinfowler.com is to spread knowledge of techniques that improve software development. I hope to find useful techniques, primarily via my Thoughtworks colleagues, and explain them clearly enough that other people an try and expand on them.
While this goal is primarily a pillar 2 effort there is a significant pillar 1 impact too. On the demand side, it helps generate leads and/or raise our credibility when looking for work. Recruiting claims that many people come to Thoughtworks because they were made aware of us by my site, or the writing there helps people consider Thoughtworks to be the right place to move to. In delivery, sometimes a post can help our consultants convince clients of a better path to take, or just help educate our clients to do a better job and appreciate what we're up to.
With pillar 3 I've been doing some writing and speaking on diversity issues and freedom of the internet. Most of my site's readers come to me for technical information, but I think it's also important to ensure they are aware of the important social issues that we face, particularly those that technologists can have an impact on.
As well as my own writing, I think it's important for me to help develop others who have an inclination. For example, a couple of years ago I spent a fair bit of time doing joint talks with Jez Humble, both to raise his profile and spread the ideas of Continuous Delivery. Although I'm sad to see Jez move on, I'm happy to continue doing this. When I started at Thoughtworks, many people saw me as the primary spokesperson for Thoughtworks in the profession, but I'm really happy to see that now Thoughtworks is known for many people, not just me. Many of the popular articles on martinfowler.com are written by people other than me, often but not always ThoughtWorkers.
As well as these professional goals for the site, it also helps with some personal goals in leading a satisfying life. I hate giving talks, and push hard to minimize them. Similarly I've been an elite member of some airline's frequent flier program since 1992, and prefer time in my own office than in an airline seat. The more influential the website is, the more I can justify spending my time writing for it, rather than travelling to yet another talking gig.
2014 Overall Traffic
Let consider some broad vanity metrics.
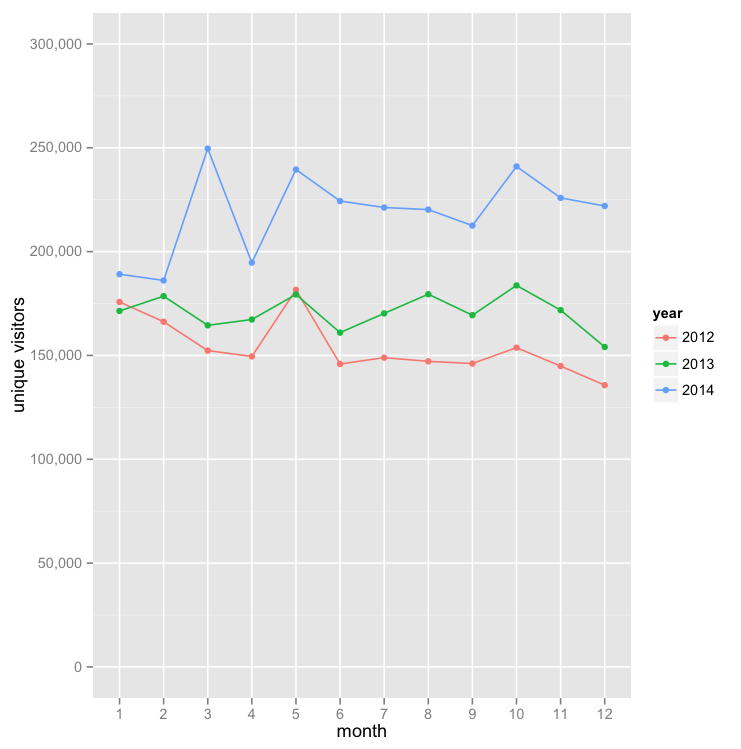
Figure 1: Comparing monthly unique visitors 2012-2014
In terms of simple visitors, the site did well in 2014, with a firm increase on the previous two years, with 186-249K visitors per month. Page views had a similar performance (historically the two track each other pretty closely on my site.) 1
1: There is a wrinkle in this data. My Google analytics reports separately for martinfowler.com and refactoring.com, even though I think of them as the same site. As a result, this visitor figure excludes anyone who visited refactoring.com and did not visit martinfowler.com.
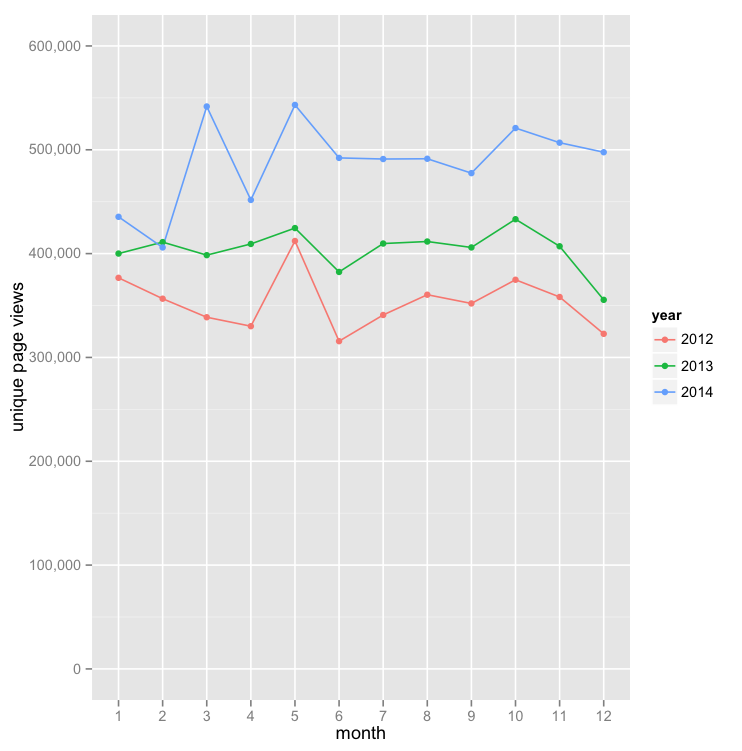
Figure 2: Comparing unique page views 2012-2014
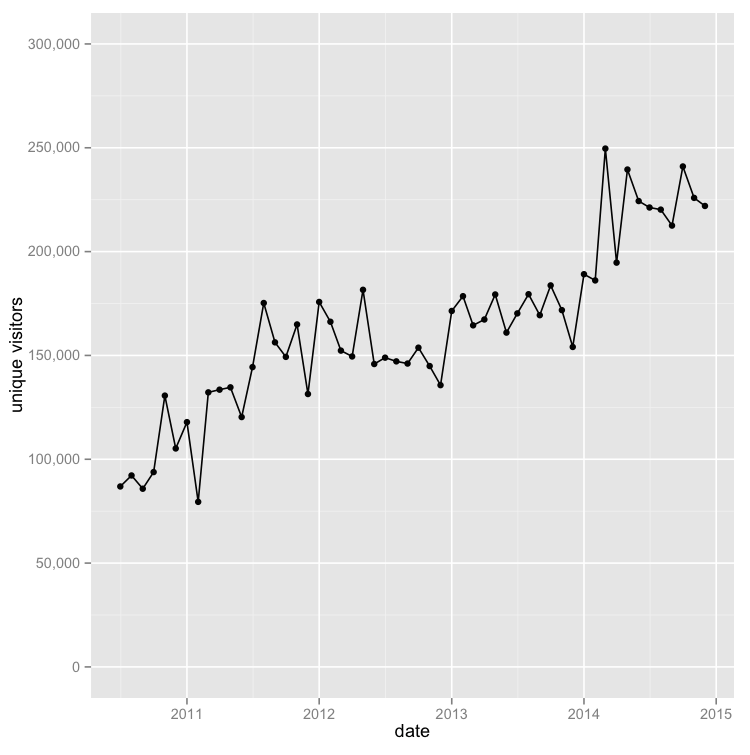
Figure 3: The long term picture of visitors since I started collecting analytics
Popular Articles
I tend to be a bit suspicious of broad page view information like this. After all, does worrying about this number just result in click-bait titles that don't have any real usefulness to my readers?
So I've been focusing on a different measure - how many popular articles do I have. For the moment, I'm defining a popular article as one that gets over 1000 unique page views in a month.
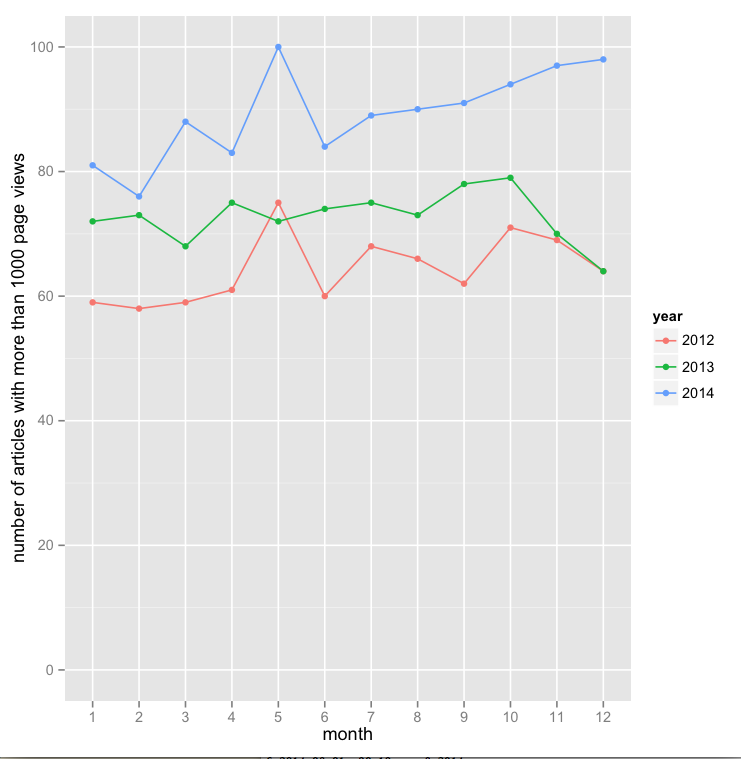
Figure 4: Comparing number of articles getting more than 1000 unique page views per month
The trend is pretty similar to that for total page views and visitors, each year a steady gain on the prior years. Such aggregates give me a warm, fuzzy, feeling. But if I want to figure out more I need to look at the actual articles.
The first thing to point out is that there's kinds of popular article. An article can get lots of traffic if it's new.
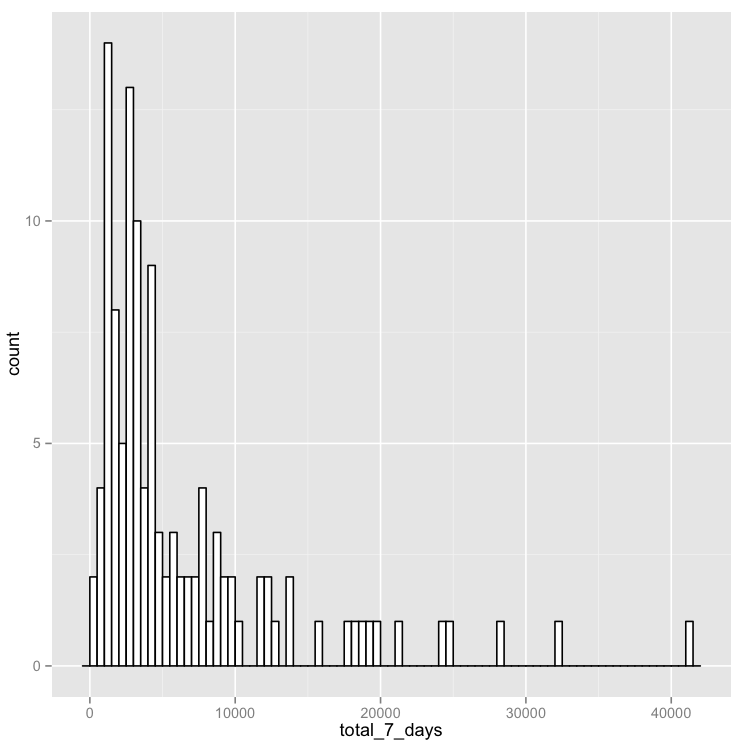
Figure 5: Histogram of total unique page views for the first seven days after launching an article. Bin size is 500. Articles are those published from 2012 to 2014.
As you can see from the histogram, most articles will get more than 1000 views in the first seven days, with a few well north of 10,000 views (usually due to the attention of Hacker News). But if we look at the results after six months, we see a different picture.
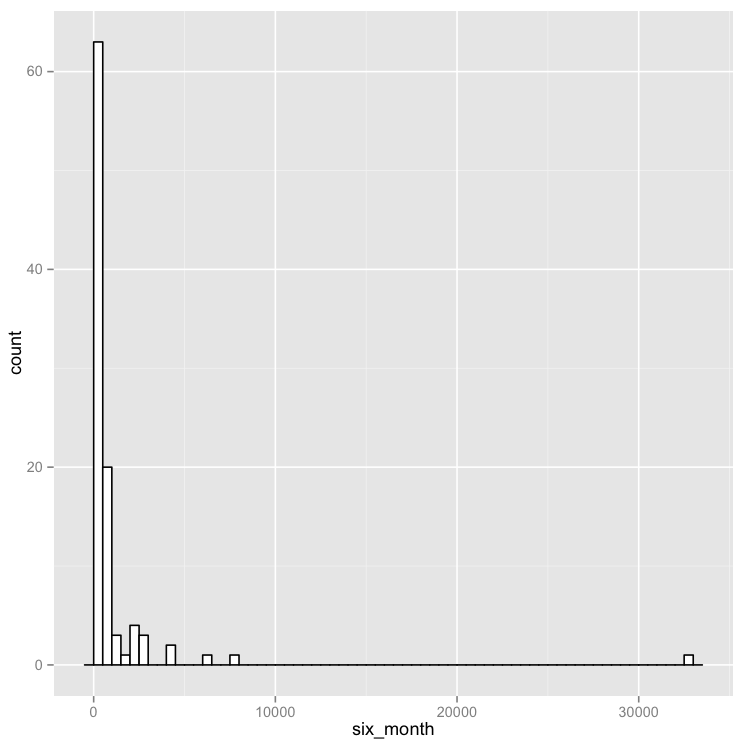
Figure 6: Histogram of total unique page views for the month that falls six months after launching an article. Bin size is 500.
After six months, most articles get less than 1000 views a month. I suspect it is the articles that are both suitably aged and popular which are the ones that are most valuable. The hip term for these articles is "evergeen". (Since it's natural to wonder, the far outlier is the article on microservices by James Lewis and myself.)
Evergreen articles in 2014
To determine the aged, popular URLs in 2014, I came up with the following definition
- The median of the page views per month during 2014 must be greater than 1000
- There must be at least four months where it garners more than 1000 page views
The second rule should remove most of the ephemerally popular articles, while allowing me to look at relatively new articles. (The shape of the 3 month histogram is pretty close to that of the 6 month one, but at some point I should do some proper correlation analysis of early to late page view scores).
Given that criteria, I end up with 86 evergreen URLs in 2014.
I've classified the URLs I'm examining into the following types:
- article: long form article, typically with several sections, would run to more than a couple of pages
- short: a shorter article, typically without sections and running under 1500 words.
- bliki: entry in the bliki, these are usually short 2 and take the form of defining the concept that is its title
- deck: An infodeck
- nav: navigation page - things like my home page and the various guide and tags pages
- books: a page describing a book of mine (or in my series)
- catalog: pages that are part of catalogs like the EAA patterns catalog or the refactoring catalog.
2: 80% of bliki entries are less than 1000 words, with only a dozen more than 1500 words (out of 464 bliki entries).
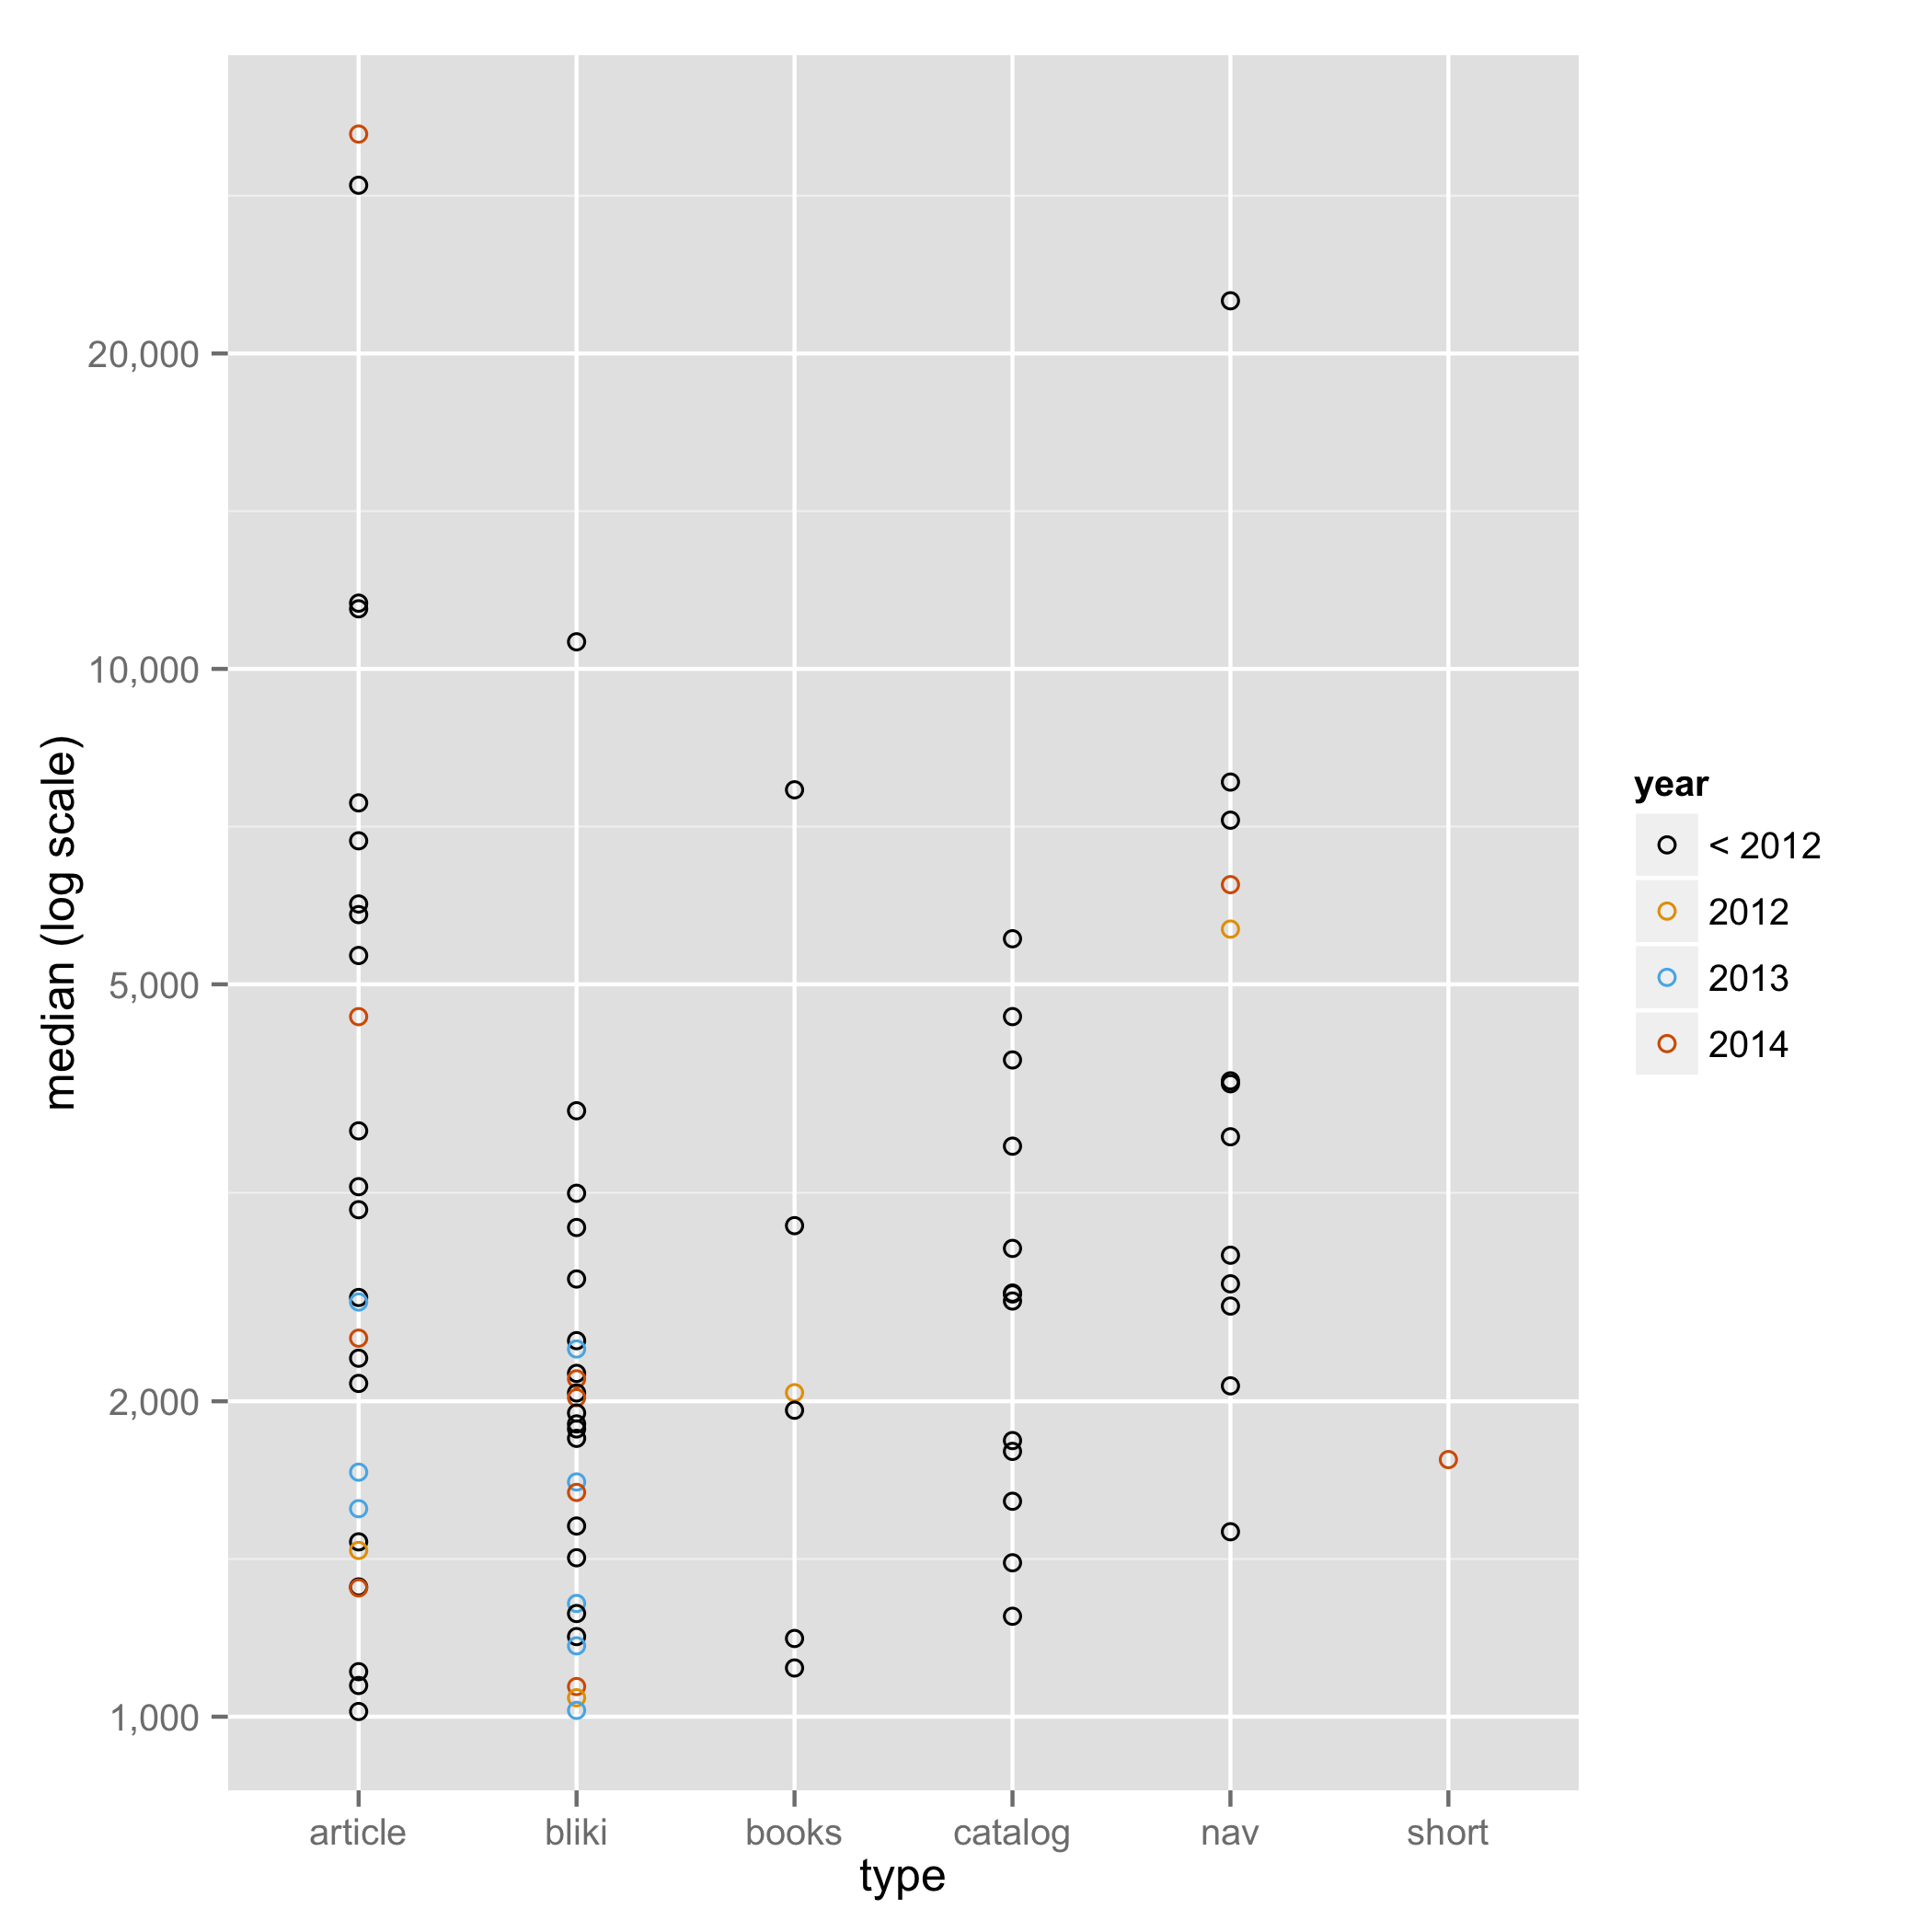
Figure 7: Stripchart of the evergreen articles, categorized by type.
One, rather sobering, thing stood out to me from this analysis. Over the last couple of years I put a fair bit of effort into creating a new form of content: infodecks. I'd hoped they would provide an engaging medium that would help explain topics, yet not one of the evergreen 86 are infodecks. 3
3: There may be hope for next year, Toby Clemsons's deck on microservice testing has had a very solid first couple of months (both around 14,000 views).
How recent posts have fared
Another way of looking at this is reviewing the URLs I've posted in the last few years, and seeing how many of them have made the evergreen list. I keep a note when I launch a new article, if nothing else to track its progress in page views after it launches.
The type classification is the same as earlier, except I've added the repost type for reposts of older articles, which I've been doing on 5th and 10th anniversaries. I haven't recorded all of these reposts in this table, as I've not been consistent in tracking their publication.
This table summarizes how many of each type I've published and how many are in the evergreen list.
| all | 2014 | |||
|---|---|---|---|---|
| type | all | evergreen | all | evergreen |
| article | 13 | 8 | 4 | 4 |
| bliki | 64 | 10 | 16 | 4 |
| books | 1 | 1 | 0 | 0 |
| deck | 6 | 0 | 1 | 0 |
| nav | 4 | 2 | 2 | 1 |
| repost | 5 | 0 | 5 | 0 |
| short | 4 | 1 | 3 | 1 |
Looking at this table, I feel less concerned about the lack of evergreen infodecks. I've only published six infodecks, and only one-sixth of bliki posts published in that time have become evergreen. So not having any evergreen decks yet isn't any evidence that the medium is less inclined to become evergreen.
On the other hand the long-form articles do seem to do rather better, although I haven't determined whether this difference is significant.
The Microservices Article
The biggest impact article this year on the site, without any doubt, is the article on Microservices that was written by James Lewis and me. It has immediately become the number 1 article on the site, with a median of 32K views per month, netting 345K in 2015.
More important than any statistics on martinfowler.com, however, is this graph.
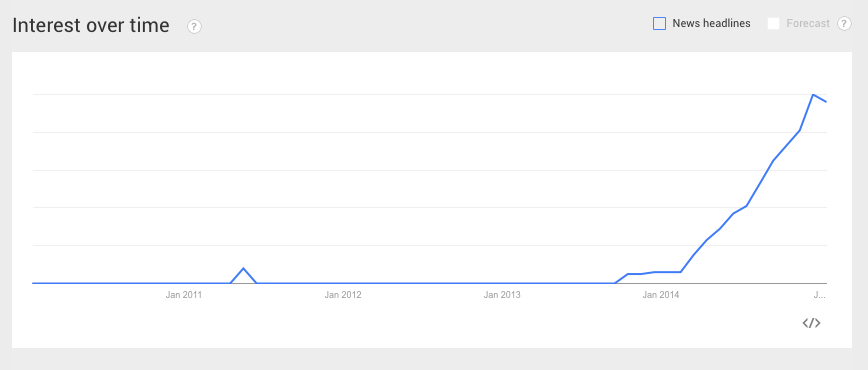
Figure 8: Google's plot of interest in the term “microservices”.
We published the article (in installments) during March of 2014 and you see at that time a huge increase in interest in the term as tracked by Google. I'm not claiming that all credit/blame for the microservices hype should be put at our feet, the term has been around for a while - first appearing in our Tech Radar in early 2012. I'm sure the various people talking about the subject would have significantly raised its profile without our contribution, but I do think we had a significant catalytic effect on it.
Sadly it's hard to put the google graph in perspective with other software development trends, so to do so, here is one compared with another term I've tried to help popularize in recent years: “Continuous Delivery”.
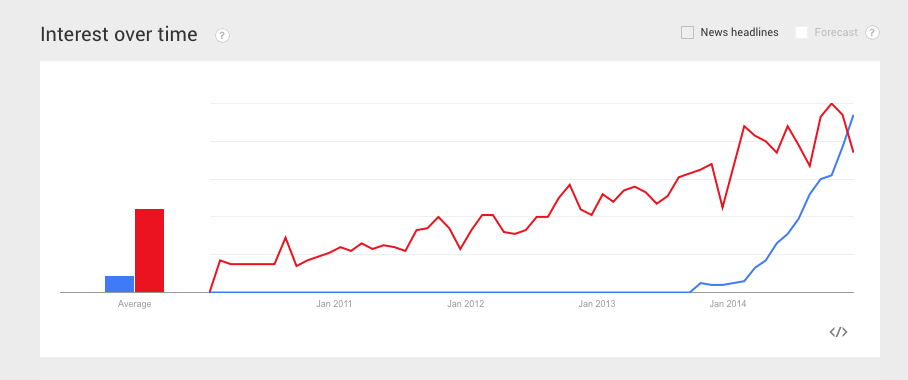
Figure 9: Google interest plot comparing "microservices" with "continuous delivery"
Page view counts, and the corresponding google interest level, are interesting measurements of the impact of the article, but fundamentally not those I see as a true measure of the article's value. That would lie in its longer term impact - primarily in how it puts down a reasonable definition of the term, which we hope will help reduce the semantic diffusion that gripped SOA so heavily from the start. Sadly, that's rather harder to plot pretty graphs about.
Word counts and enduring popularity
From time to time I hear that short articles are more popular in our ADD-infected, modern society. Some of the earlier sections suggested this may not be the case, at least once you look to the long term. To dig into this a bit further, I took all the articles (short and long) and bliki posts in the last couple of years (Jan 2012Sep 2014) and did a scatterplot against recent page views.
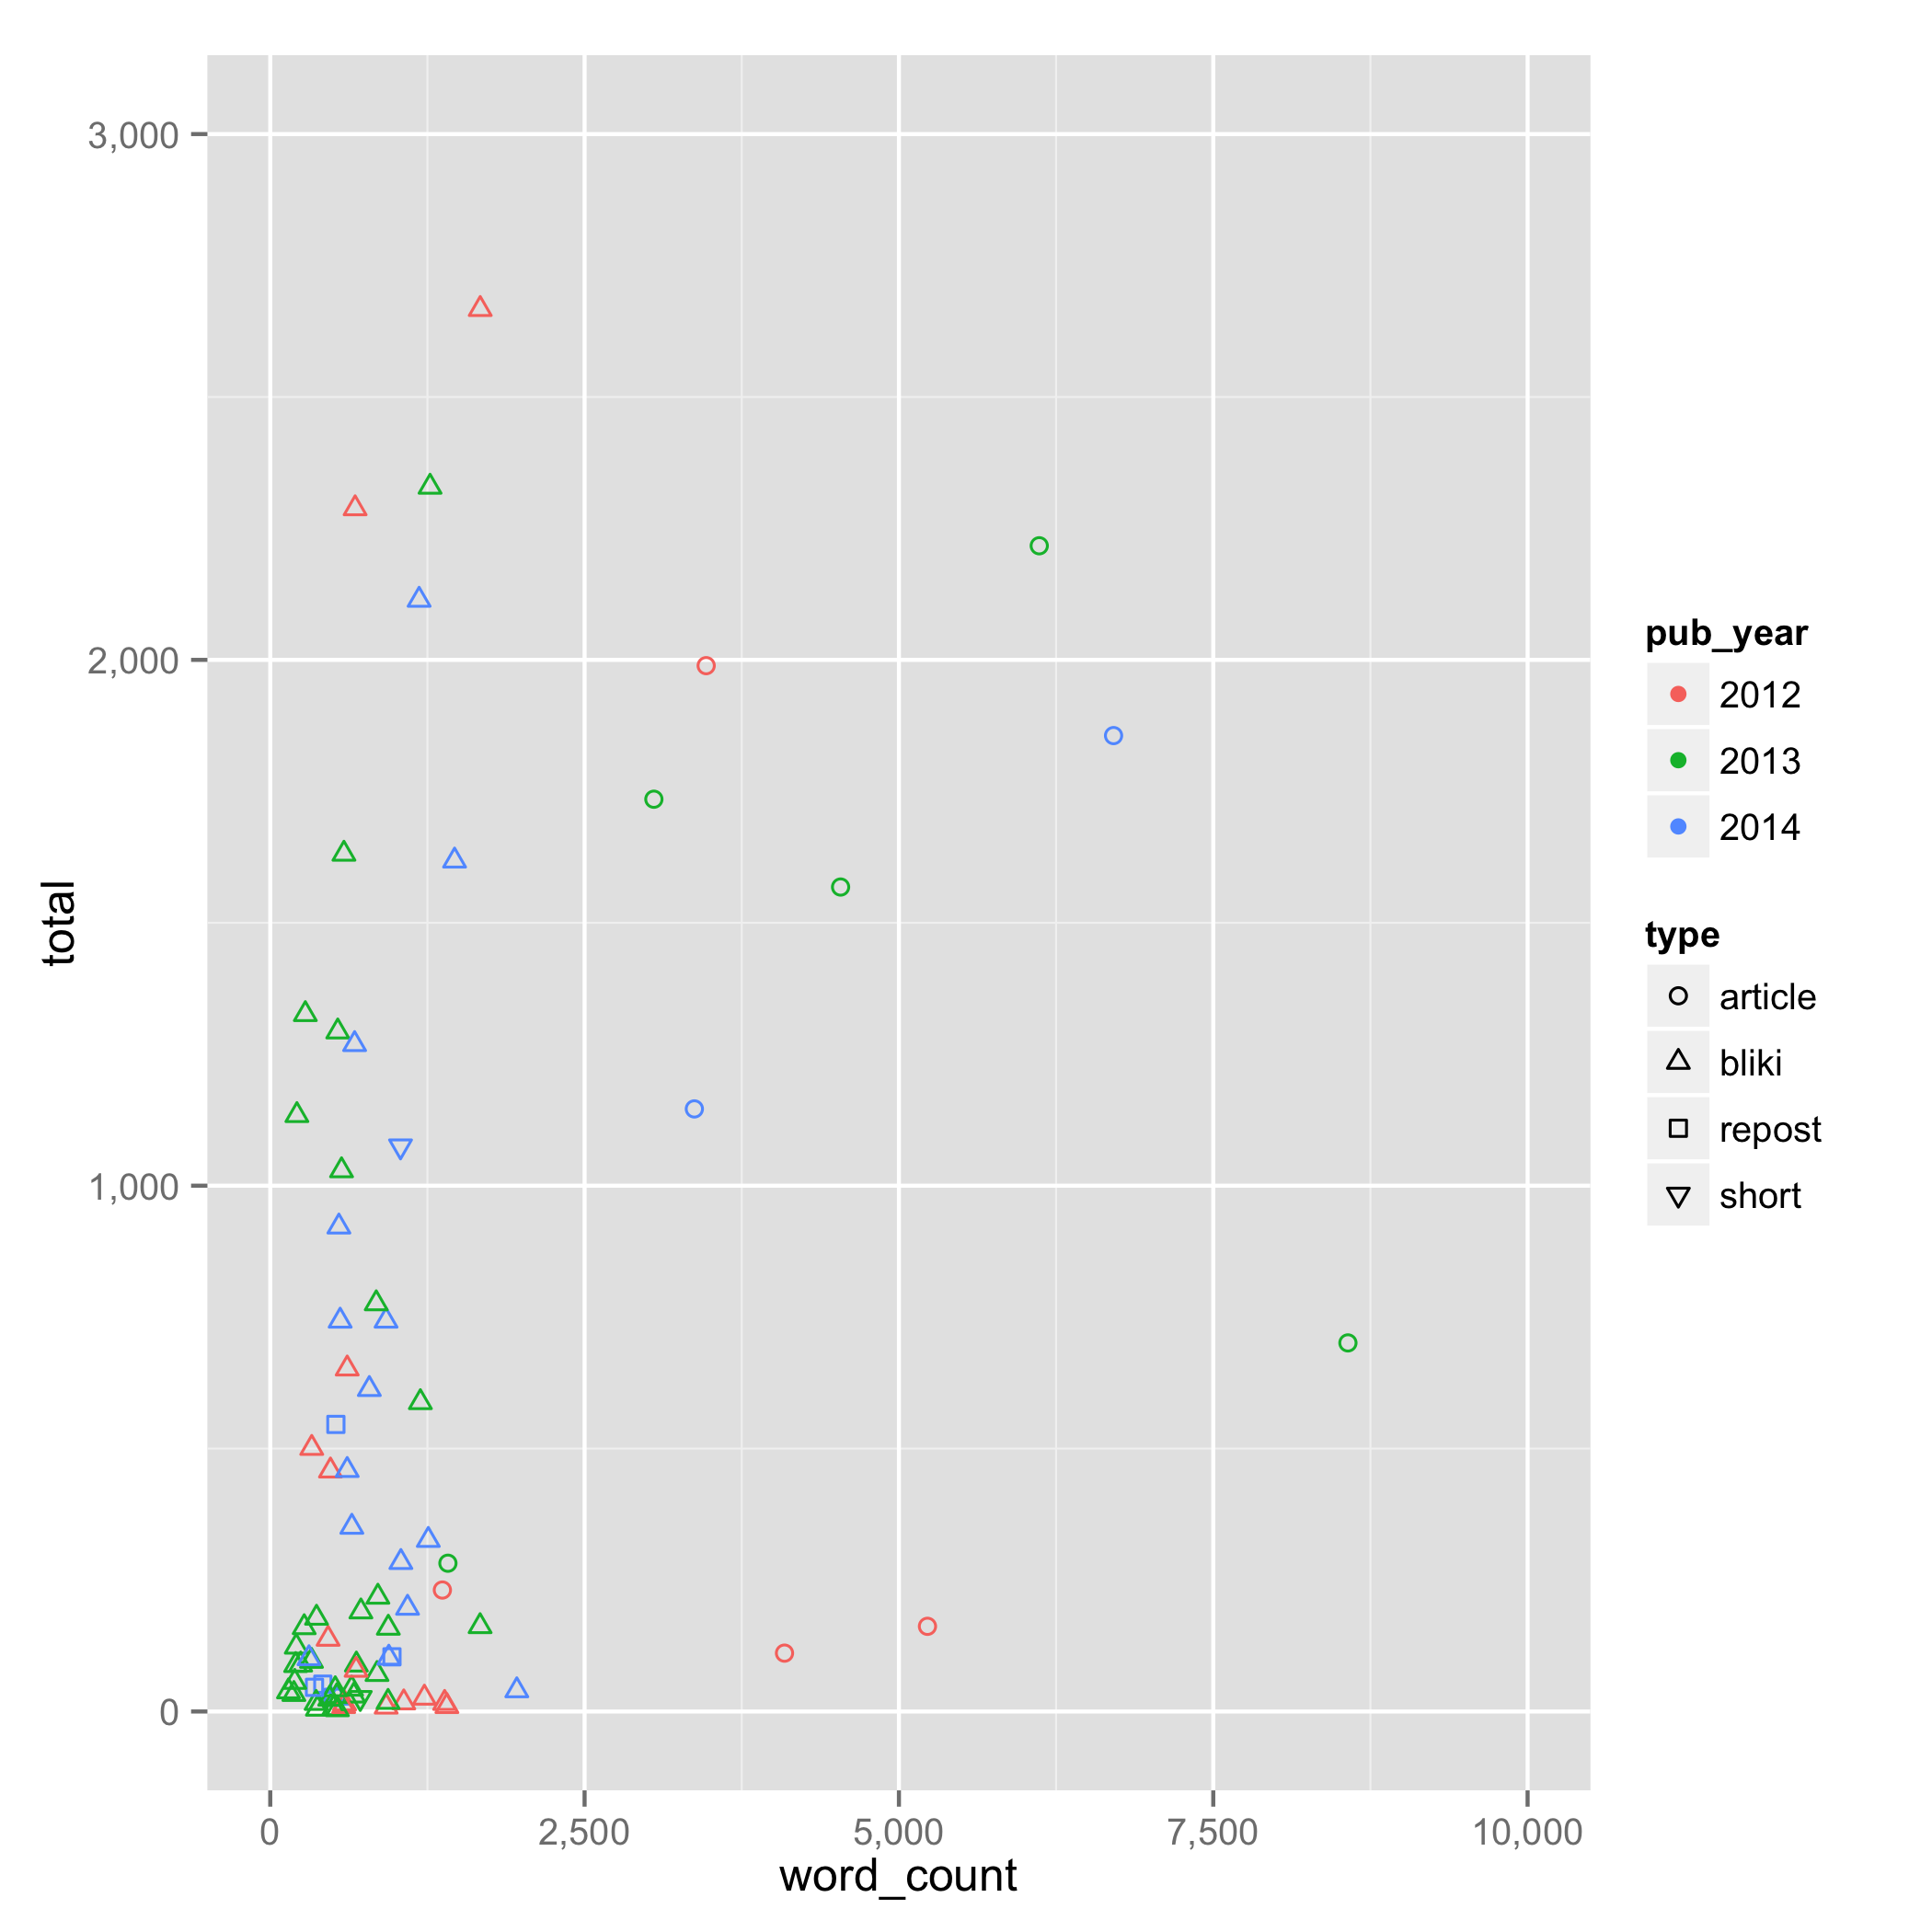
Figure 10: Scatterplot comparing word counts of articles published between Jan 2012 and Sep 2014 and their unique page views for Dec 2014. (I removed two outliers, the microservices article (37,249 : 5,746) and the testing culture article (1,207 : 27,596))
If you can see any correlation on this graph, let me know, for I certainly can't. It does reinforce that there seems to be a greater proportion of successful longer articles than short posts, but my statistics skills are too limited to analyze this further.
Contributing Authors
As well as writing articles myself, I'm keen to get articles from others. Many of these contributed articles come from my colleagues in Thoughtworks, but some of them come from other contacts within the profession. Editing articles like this is often considerable work, sometimes it feels like more work than writing them myself, but I think it's important for me to use the platform I have to help amplify other worthwhile voices.
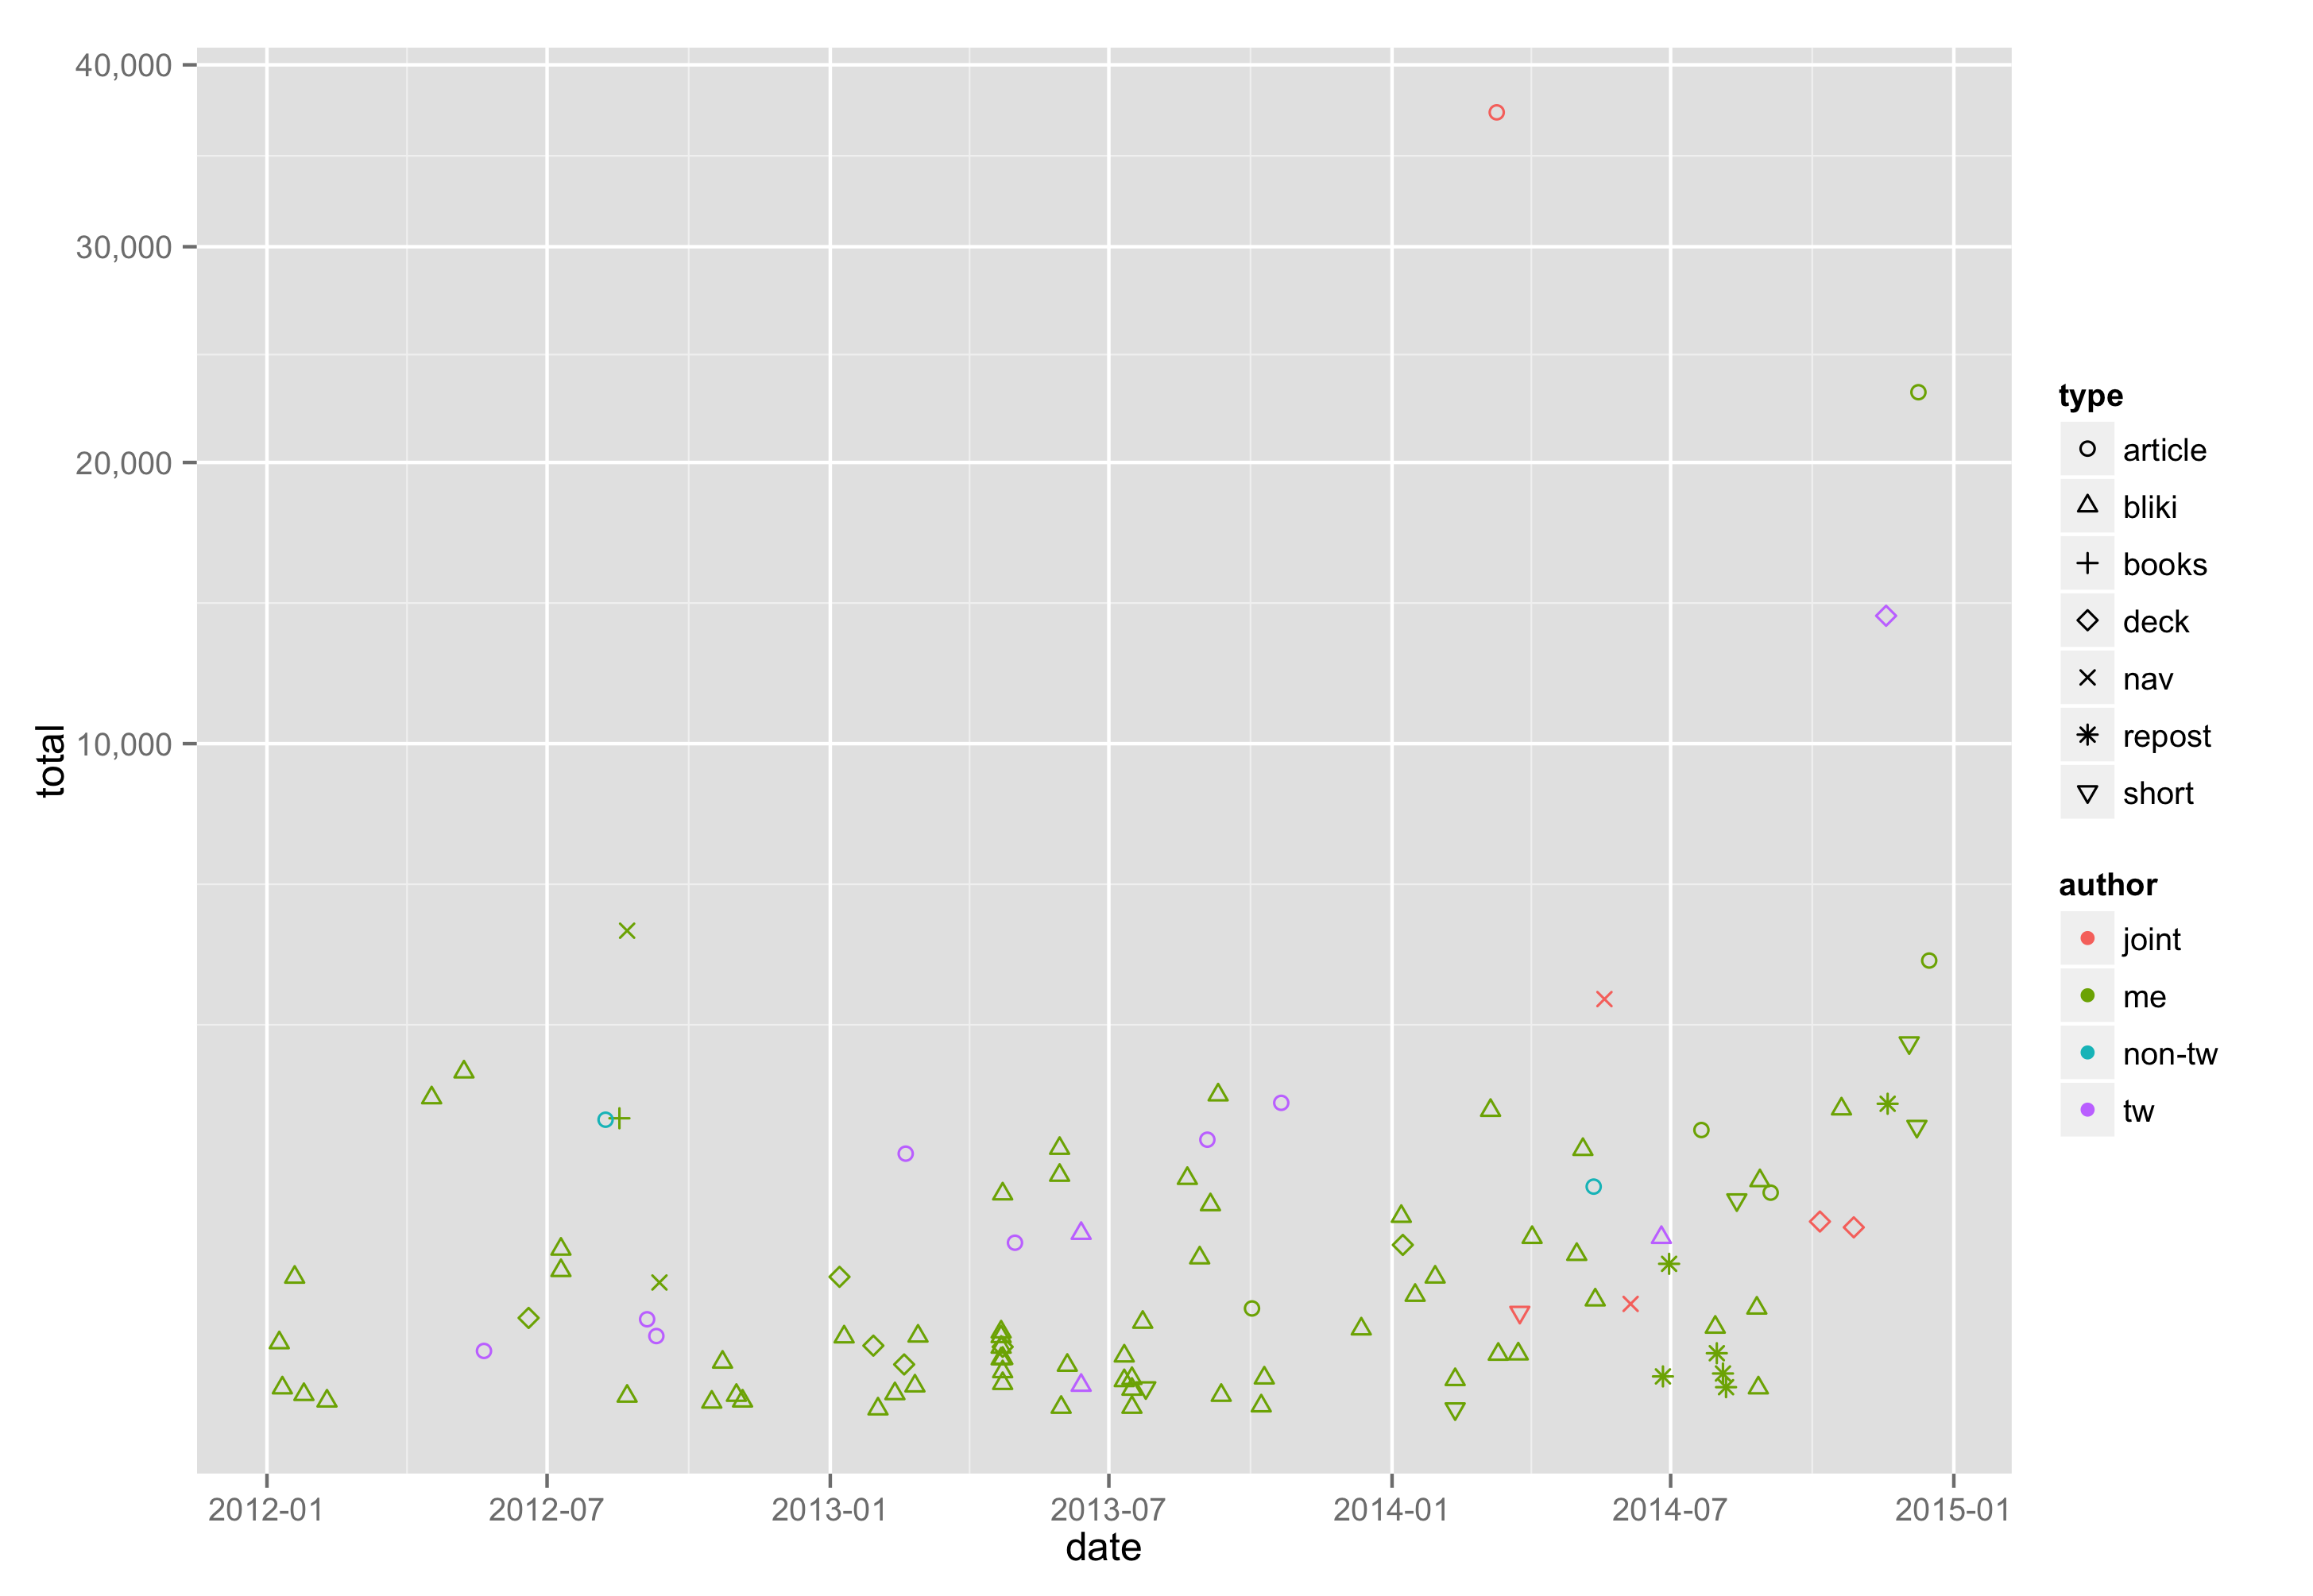
Figure 11: Scatter plot of articles published since 2012 showing their december page views, kind of authorship, and type of article.
Nine articles involving contributors are on the evergreen list.
| Path | Credits | views | rank |
|---|---|---|---|
| /articles/microservices.html | James Lewis and Martin Fowler | 32391 | 1 |
| /articles/itsNotJustStandingUp.html | Jason Yip | 5966 | 13 |
| /articles/consumerDrivenContracts.html | Ian Robinson | 2513 | 38 |
| /articles/enterpriseREST.html | Brandon Byars | 2488 | 40 |
| /articles/testing-culture.html | Mike Bland | 2298 | 42 |
| /articles/evodb.html | Martin Fowler and Pramod Sadalage | 2199 | 45 |
| /articles/asyncJS.html | Pete Hodgson | 1712 | 61 |
| /articles/useOfMetrics.html | Pat Kua | 1580 | 65 |
| /articles/agileFluency.html | Diana Larsen and James Shore | 1441 | 69 |
Footnotes
1: There is a wrinkle in this data. My Google analytics reports separately for martinfowler.com and refactoring.com, even though I think of them as the same site. As a result, this visitor figure excludes anyone who visited refactoring.com and did not visit martinfowler.com.
2: 80% of bliki entries are less than 1000 words, with only a dozen more than 1500 words (out of 464 bliki entries).
3: There may be hope for next year, Toby Clemsons's deck on microservice testing has had a very solid first couple of months (both around 14,000 views).
Significant Revisions
28 January 2015: Published to Thoughtworks Town Hall mailing list
13 January 2015: Circulated to Thoughtworks content strategy group

