Bottleneck #04: Cost Efficiency

Surging cloud and managed services costs outpacing customer growth

17 August 2023


Photo of Sofia Tania

Tania is an engineer and engineering leader at Thoughtworks, a Technical Scaling Subject Matter Expert with the Digital Scale-up Group and a member of Thoughtworks' Technology Advisory Board that prepares the Technology Radar. As a tech generalist, she enjoys both going deep into the weeds and taking a big-picture view — always in service of making clients successful. Tania has led teams working on data products and platforms, backend APIs, and infrastructure platforms for companies of various sizes in a range of industries. She has also helped organizations craft their technology strategy.

Photo of Stefania Stefansdottir

Stefania is a technical principal, software architect, and consultant for Thoughtworks. She has worked in various sectors focusing mostly on delivering modern digital platforms, data products and platforms, and consulting on complex organizational and technology problems.


Every startup's journey is unique, and the road to success is never linear, but cost is a narrative in every business at every point in time, especially during economic downturns. In a startup, the conversation around cost shifts when moving from the experimental and gaining traction phases to high growth and optimizing phases. In the first two phases, a startup needs to operate lean and fast to come to a product-market fit, but in the later stages the importance of operational efficiency eventually grows.

Shifting the company’s mindset into achieving and maintaining cost efficiency is really difficult. For startup engineers that thrive on building something new, cost optimization is typically not an exciting topic. For those reasons, cost efficiency often becomes a bottleneck for startups at some point in their journey, just like accumulation of technical debt.

How did you get into the bottleneck?

In the early experimental phase of startups, when funding is limited, whether bootstrapped by founders or supported by seed investment, startups generally focus on getting market traction before they run out of their financial runway. Teams will pick solutions that get the product to market quickly so the company can generate revenue, keep users happy, and outperform competitors.

In these phases, cost inefficiency is an acceptable trade-off. Engineers may choose to go with quick custom code instead of dealing with the hassle of setting up a contract with a SaaS provider. They may deprioritize cleanups of infrastructure components that are no longer needed, or not tag resources as the organization is 20-people strong and everyone knows everything. Getting to market quickly is paramount – after all, the startup might not be there tomorrow if product-market fit remains elusive.

After seeing some success with the product and reaching a rapid growth phase, those previous decisions can come back to hurt the company. With traffic spiking, cloud costs surge beyond anticipated levels. Managers know the company’s cloud costs are high, but they may have trouble pinpointing the cause and guiding their teams to get out of the situation.

At this point, costs are starting to be a bottleneck for the business. The CFO is noticing, and the engineering team is getting a lot of scrutiny. At the same time, in preparation for another funding round, the company would need to show reasonable COGS (Cost of Goods Sold).

None of the early decisions were wrong. Creating a perfectly scalable and cost efficient product is not the right priority when market traction for the product is unknown. The question at this point, when cost starts becoming a problem, is how to start to reduce costs and change the company culture to sustain the improved operational cost efficiency. These changes will ensure the continued growth of the startup.

Signs you are approaching a scaling bottleneck

Lack of cost visibility and attribution

When a company uses multiple service providers (cloud, SaaS, development tools, etc.), the usage and cost data of these services lives in disparate systems. Making sense of the total technology cost for a service, product, or team requires pulling this data from various sources and linking the cost to their product or feature set.

These cost reports (such as cloud billing reports) can be overwhelming. Consolidating and making them easily understandable is quite an effort. Without proper cloud infrastructure tagging conventions, it is impossible to properly attribute costs to specific aggregates at the service or team level. However, unless this level of accounting clarity is enabled, teams will be forced to operate without fully understanding the cost implications of their decisions.

Cost not a consideration in engineering solutions

Engineers consider various factors when making engineering decisions - functional and non-functional requirements (performance, scalability and security etc). Cost, however, is not always considered. Part of the reason, as covered above, is that development teams often lack visibility on cost. In some cases, while they have a reasonable level of visibility on the cost of their part of the tech landscape, cost may not be perceived as a key consideration, or may be seen as another team’s concern.

Signs of this problem might be the lack of cost considerations mentioned in design documents / RFCs / ADRs, or whether an engineering manager can show how the cost of their products will change with scale.

Homegrown non-differentiating capabilities

Companies sometimes maintain custom tools that have major overlaps in capabilities with third-party tools, whether open-source or commercial. This may have happened because the custom tools predate those third-party solutions – for example, custom container orchestration tools before Kubernetes came along. It could also have grown from an early initial shortcut to implement a subset of capability provided by mature external tools. Over time, individual decisions to incrementally build on that early shortcut lead the team past the tipping point that might have led to utilizing an external tool.

Over the long term, the total cost of ownership of such homegrown systems can become prohibitive. Homegrown systems are typically very easy to start and quite difficult to master.

Overlapping capabilities in multiple tools / tool explosion

Having multiple tools with the same purpose – or at least overlapping purposes, e.g. multiple CI/CD pipeline tools or API observability tools, can naturally create cost inefficiencies. This often comes about when there isn’t a paved road, and each team is autonomously picking their technical stack, rather than choosing tools that are already licensed or preferred by the company.

Inefficient contract structure for managed services

Choosing managed services for non-differentiating capabilities, such as SMS/email, observability, payments, or authorization can greatly support a startup’s pursuit to get their product to market quickly and keep operational complexity in check.

Managed service providers often provide compelling – cheap or free – starter plans for their services. These pricing models, however, can get expensive more quickly than anticipated. Cheap starter plans aside, the pricing model negotiated initially may not suit the startup’s current or projected usage. Something that worked for a small organization with few customers and engineers might become too expensive when it grows to 5x or 10x those numbers. An escalating trend in the cost of a managed service per user (be it employees or customers) as the company achieves scaling milestones is a sign of a growing inefficiency.

Unable to reach economies of scale

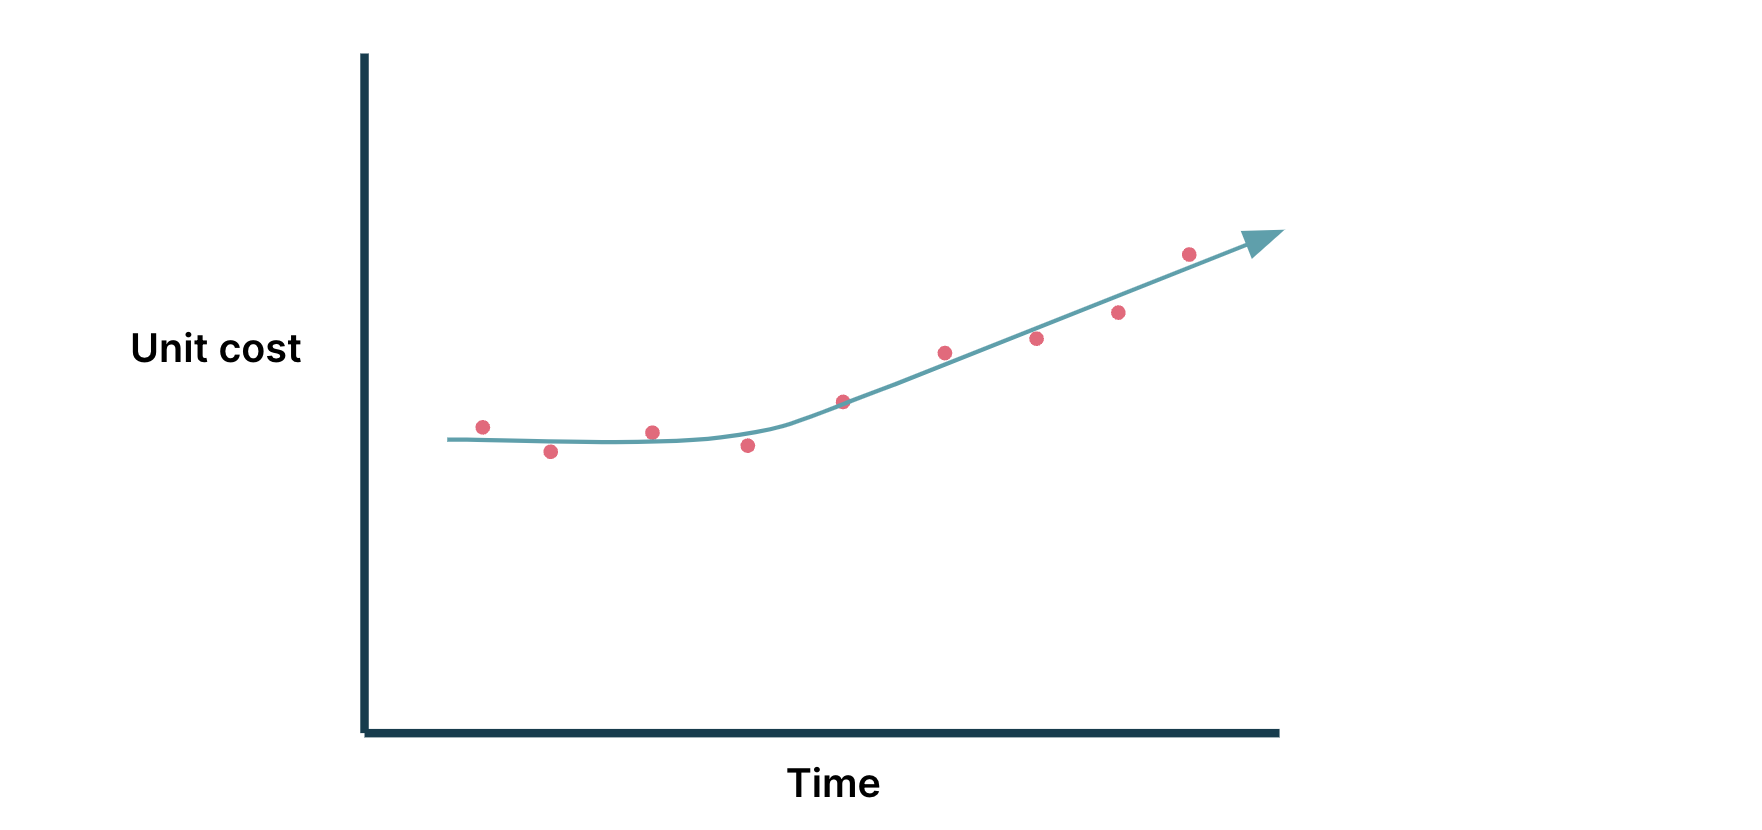
In any architecture, the cost is correlated to the number of requests, transactions, users using the product, or a combination of them. As the product gains market traction and matures, companies hope to gain economies of scale, reducing the average cost to serve each user or request (unit cost) as its user base and traffic grows. If a company is having trouble achieving economies of scale, its unit cost would instead increase.

Figure 1: Not reaching economies of scale: increasing unit cost

Note: in this example diagram, it is implied that there are more units (requests, transactions, users as time progresses)

How do you get out of the bottleneck?

A normal scenario for our team when we optimize a scaleup, is that the company has noticed the bottleneck either by monitoring the signs mentioned above, or it’s just plain obvious (the planned budget was completely blown). This triggers an initiative to improve cost efficiency. Our team likes to organize the initiative around two phases, a reduce and a sustain phase.

The reduce phase is focused on short term wins – “stopping the bleeding”. To do this, we need to create a multi-disciplined cost optimization team. There may be some idea of what is possible to optimize, but it is necessary to dig deeper to really understand. After the initial opportunity analysis, the team defines the approach, prioritizes based on the impact and effort, and then optimizes.

After the short-term gains in the reduce phase, a properly executed sustain phase is critical to maintain optimized cost levels so that the startup does not have this problem again in the future. To support this, the company’s operating model and practices are adapted to improve accountability and ownership around cost, so that product and platform teams have the necessary tools and information to continue optimizing.

To illustrate the reduce and sustain phased approach, we will describe a recent cost optimization undertaking.

Case study: Databricks cost optimization

A client of ours reached out as their costs were increasing more than they expected. They had already identified Databricks costs as a top cost driver for them and requested that we help optimize the cost of their data infrastructure. Urgency was high - the increasing cost was starting to eat into their other budget categories and growing still.

After initial analysis, we quickly formed our cost optimization team and charged them with a goal of reducing cost by ~25% relative to the chosen baseline.

The “Reduce” phase

With Databricks as the focus area, we enumerated all the ways we could impact and manage costs. At a high level, Databricks cost consists of virtual machine cost paid to the cloud provider for the underlying compute capability and cost paid to Databricks (Databricks Unit cost / DBU).

Each of these cost categories has its own levers - for example, DBU cost can change depending on cluster type (ephemeral job clusters are cheaper), purchase commitments (Databricks Commit Units / DBCUs), or optimizing the runtime of the workload that runs on it.

As we were tasked to “save cost yesterday”, we went in search of quick wins. We prioritized those levers against their potential impact on cost and their effort level. As the transformation logic in the data pipelines are owned by respective product teams and our working group did not have a good handle on them, infrastructure-level changes such as cluster rightsizing, using ephemeral clusters where appropriate, and experimenting with Photon runtime had lower effort estimates compared to optimization of the transformation logic.

We started executing on the low-hanging fruits, collaborating with the respective product teams. As we progressed, we monitored the cost impact of our actions every 2 weeks to see if our cost impact projections were holding up, or if we needed to adjust our priorities.

The savings added up. A few months in, we exceeded our goal of ~25% cost savings monthly against the chosen baseline.

The “Sustain” phase

However, we did not want cost savings in areas we had optimized to creep back up when we turned our attention to other areas still to be optimized. The tactical steps we took had reduced cost, but sustaining the lower spending required continued attention due to a real risk - every engineer was a Databricks workspace administrator capable of creating clusters with any configuration they choose, and teams were not monitoring how much their workspaces cost. They were not held accountable for those costs either.

To address this, we set out to do two things: tighten access control and improve cost awareness and accountability.

To tighten access control, we limited administrative access to just the people who needed it. We also used Databricks cluster policies to limit the cluster configuration options engineers can pick – we wanted to achieve a balance between allowing engineers to make changes to their clusters and limiting their choices to a sensible set of options. This allowed us to minimize overprovisioning and control costs.

To improve cost awareness and accountability, we configured budget alerts to be sent out to the owners of respective workspaces if a particular month’s cost exceeds the predetermined threshold for that workspace.

Both phases were key to reaching and sustaining our objectives. The savings we achieved in the reduced phase stayed stable for a number of months, save for completely new workloads.

Reduce phase

Before engineers rush into optimizing cost individually within their own teams, it’s best to assemble a cross-functional team to perform analysis and lead execution of cost optimization efforts. Typically, cost efficiency at a startup will fall into the responsibility of the platform engineering team, since they will be the first to notice the problem – but it will require involvement from many areas. We recommend getting a cost optimization team together, consisting of technologists with infrastructure skills and those who have context over the backend and data systems. They will need to coordinate efforts among impacted teams and create reports, so a technical program manager will be valuable.

Understand primary cost drivers

It is important to start with identifying the primary cost drivers. First, the cost optimization team should collect relevant invoices – these can be from cloud provider(s) and SaaS providers. It is useful to categorize the costs using analytical tools, whether a spreadsheet, a BI tool, or Jupyter notebooks. Analyzing the costs by aggregating across different dimensions can yield unique insights which can help identify and prioritize the work to achieve the greatest impact. For example:

Application/system: Some applications/systems may contribute to more costs than others. Tagging helps associate costs to different systems and helps identify which teams may be involved in the work effort.

Compute vs storage vs network: In general: compute costs tend to be higher than storage costs; network transfer costs can sometimes be a surprise high-costing item. This can help identify whether hosting strategies or architecture changes may be helpful.

Pre-production vs production (environment): Pre-production environments’ cost should be quite a bit lower than production’s. However, pre-production environments tend to have more lax access control, so it is not uncommon that they cost higher than expected. This could be indicative of too much data accumulating in non-prod environments, or even a lack of cleanup for temporary or PoC infrastructure.

Operational vs analytical: While there is no rule of thumb for how much a company’s operational systems should cost as compared to its analytical ones, engineering leadership should have a sense of the size and value of the operational vs analytical landscape in the company that can be compared with actual spending to identify an appropriate ratio.

Service / capability provider: ​​Across project management, product roadmapping, observability, incident management, and development tools, engineering leaders are often surprised by the number of tool subscriptions and licenses in use and how much they cost. This can help identify opportunities for consolidation, which may also lead to improved negotiating leverage and lower costs.

The results of the inventory of drivers and costs associated with them should provide the cost optimization team a much better idea what type of costs are the highest and how the company’s architecture is affecting them. This exercise is even more effective at identifying root causes when historical data is considered, e.g. costs from the past 3-6 months, to correlate changes in costs with specific product or technical decisions.

Identify cost-saving levers for the primary cost drivers

After identifying the costs, the trends and what are driving them, the next question is - what levers can we employ to reduce costs? Some of the more common methods are covered below. Naturally, the list below is far from exhaustive, and the right levers are often very situation-dependent.

Rightsizing: Rightsizing is the action of changing the resource configuration of a workload to be closer to its utilization.

Engineers often perform an estimation to see what resource configuration they need for a workload. As the workloads evolve over time, the initial exercise is rarely followed-up to see if the initial assumptions were correct or still apply, potentially leaving underutilized resources.

To rightsize VMs or containerized workloads, we compare utilization of CPU, memory, disk, etc. vs what was provisioned. At a higher level of abstraction, managed services such as Azure Synapse and DynamoDB have their own units for provisioned infrastructure and their own monitoring tools that would highlight any resource underutilization. Some tools go so far as to recommend optimal resource configuration for a given workload.

There are ways to save costs by changing resource configurations without strictly reducing resource allocation. Cloud providers have multiple instance types, and usually, more than one instance type can satisfy any particular resource requirement, at different price points. In AWS for example, new versions are generally cheaper, t3.small is ~10% lower than t2.small. Or for Azure, even though the specs on paper appear higher, E-series is cheaper than D-series – we helped a client save 30% off VM cost by swapping to E-series.

As a final tip: while rightsizing particular workloads, the cost optimization team should keep any pre-purchase commitments on their radar. Some pre-purchase commitments like Reserved Instances are tied to specific instance types or families, so while changing instance types for a particular workload could save cost for that specific workload, it could lead to part of the Reserved Instance commitment going unused or wasted.

Using ephemeral infrastructure: Frequently, compute resources operate longer than they need to. For example, interactive data analytics clusters used by data scientists who work in a particular timezone may be up 24/7, even though they are not used outside of the data scientists’ working hours. Similarly, we have seen development environments stay up all day, every day, whereas the engineers working on them use them only within their working hours.

Many managed services offer auto-termination or serverless compute options that ensure you are only paying for the compute time you actually use – all useful levers to keep in mind. For other, more infrastructure-level resources such as VMs and disks, you could automate shutting down or cleaning up of resources based on your set criteria (e.g. X minutes of idle time).

Engineering teams may look at moving to FaaS as a way to further adopt ephemeral computing. This needs to be thought about carefully, as it is a serious undertaking requiring significant architecture changes and a mature developer experience platform. We have seen companies introduce a lot of unnecessary complexity jumping into FaaS (at the extreme: lambda pinball).

Incorporating spot instances: The unit cost of spot instances can be up to ~70% lower than on-demand instances. The caveat, of course, is that the cloud provider can claim spot instances back at short notice, which risks the workloads running on them getting disrupted. Therefore, cloud providers generally recommend that spot instances are used for workloads that more easily recover from disruptions, such as stateless web services, CI/CD workload, and ad-hoc analytics clusters.

Even for the above workload types, recovering from the disruption takes time. If a particular workload is time-sensitive, spot instances may not be the best choice. Conversely, spot instances could be an easy fit for pre-production environments, where time-sensitivity is less stringent.

Leveraging commitment-based pricing: When a startup reaches scale and has a clear idea of its usage pattern, we advise teams to incorporate commitment-based pricing into their contract. On-demand prices are typically higher than prices you can get with pre-purchase commitments. However, even for scale-ups, on-demand pricing could still be useful for more experimental products and services where usage patterns have not stabilized.

There are multiple types of commitment-based pricing. They all come at a discount compared to the on-demand price, but have different characteristics. For cloud infrastructure, Reserved Instances are generally a usage commitment tied to a specific instance type or family. Savings Plans is a usage commitment tied to the usage of specific resource (e.g. compute) units per hour. Both offer commitment periods ranging from 1 to 3 years. Most managed services also have their own versions of commitment-based pricing.

Architectural design: With the popularity of microservices, companies are creating finer-grained architecture approaches. It is not uncommon for us to encounter 60 services at a mid-stage digital native.

However, APIs that aren’t designed with the consumer in mind send large payloads to the consumer, even though they need a small subset of that data. In addition, some services, instead of being able to perform certain tasks independently, form a distributed monolith, requiring multiple calls to other services to get its task done. As illustrated in these scenarios, improper domain boundaries or over-complicated architecture can show up as high network costs.

Refactoring your architecture or microservices design to improve the domain boundaries between systems will be a big project, but will have a large long-term impact in many ways, beyond reducing cost. For organizations not ready to embark on such a journey, and instead are looking for a tactical approach to combat the cost impact of these architectural issues, strategic caching can be employed to minimize chattiness.

Enforcing data archival and retention policy: The hot tier in any storage system is the most expensive tier for pure storage. For less frequently-used data, consider putting them in cool or cold or archive tier to keep costs down.

It is important to review access patterns first. One of our teams came across a project that stored a lot of data in the cold tier, and yet were facing increasing storage costs. The project team did not realize that the data they put in the cold tier were frequently accessed, leading to the cost increase.

Consolidating duplicative tools: While enumerating the cost drivers in terms of service providers, the cost optimization team may realize the company is paying for multiple tools within the same category (e.g. observability), or even wonder if any team is really using a particular tool. Eliminating unused resources/tools and consolidating duplicative tools in a category is certainly another cost-saving lever.

Depending on the volume of usage after consolidation, there may be additional savings to be gained by qualifying for a better pricing tier, or even taking advantage of increased negotiation leverage.

Prioritize by effort and impact

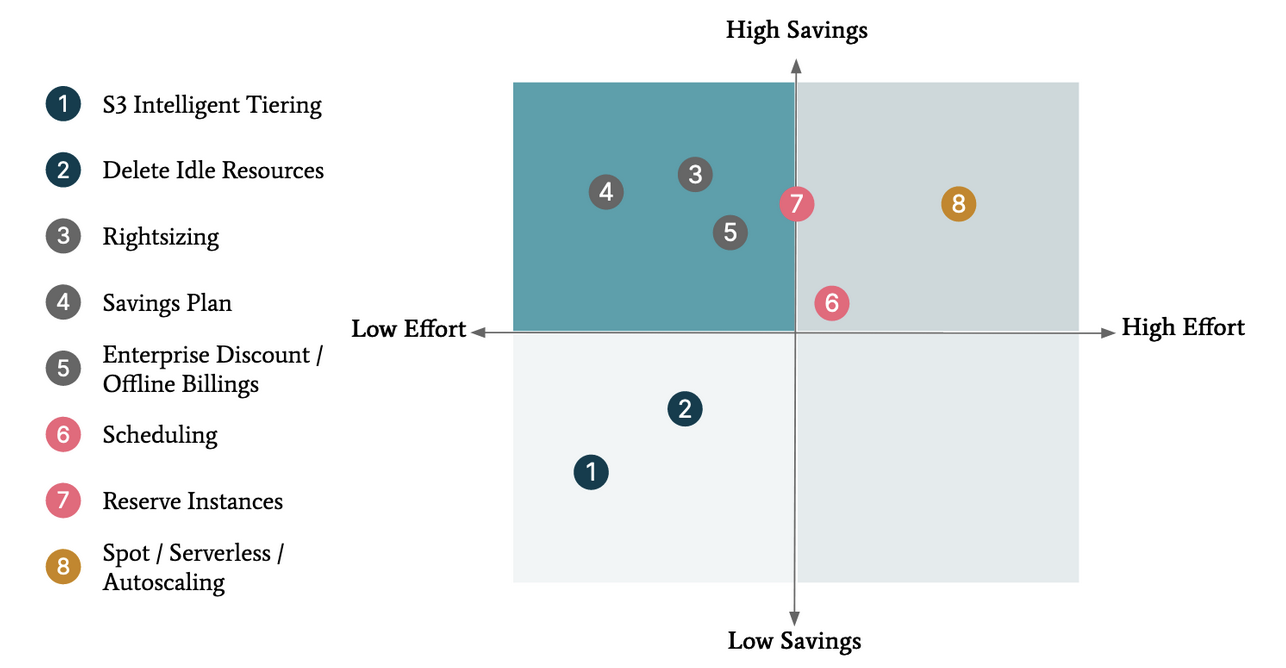
Any potential cost-saving opportunity has two important characteristics: its potential impact (size of potential savings), and the level of effort needed to realize them.

If the company needs to save costs quickly, saving 10% out of a category that costs $50,000 naturally beats saving 10% out of a category that costs $5,000.

However, different cost-saving opportunities require different levels of effort to realize them. Some opportunities require changes in code or architecture which take more effort than configuration changes such as rightsizing or utilizing commitment-based pricing. To get a good understanding of the required effort, the cost optimization team will need to get input from relevant teams.

Figure 2: Example output from a prioritization exercise for a client (the same exercise done for a different company could yield different results)

At the end of this exercise, the cost optimization team should have a list of opportunities, with potential cost savings, the effort to realize them, and the cost of delay (low/high) associated with the lead time to implementation. For more complex opportunities, a proper financial analysis needs to be specified as covered later. The cost optimization team would then review with leaders sponsoring the initiative, prioritize which to act upon, and make any resource requests required for execution.

The cost optimization team should ideally work with the impacted product and platform teams for execution, after giving them enough context on the action needed and reasoning (potential impact and priority). However, the cost optimization team can help provide capacity or guidance if needed. As execution progresses, the team should re-prioritize based on learnings from realized vs projected savings and business priorities.

Sustain phase

When cost reduction activities have delivered savings, it can be tempting to celebrate and call it a day. In our experience, however, there is always the inherent risk of costs creeping back up if teams don’t take steps to maintain the reduced cost levels in the organization. A Sustain Phase that embeds cost awareness and optimization to the company’s operating model will help keep costs down.

Federate accountability for cost management

For the reduce phase, we recommended putting together a cost optimization team that works with relevant teams to execute on prioritized cost-saving opportunities. To sustain the optimized cost levels, accountability over cost management needs to shift from that cost optimization team to the respective teams.

Most startups we have worked with have adopted the product team model (including platform engineering product teams), which means many of their teams have a good idea of what systems they own. A product team owns the custom software it needs to run its product, and any unique third-party systems that are required for their functionality. A platform team owns the systems related to the capability they provide. This might be technical capabilities such as the CI/CD or observability, or it might be a reusable business capability, such as payments.

However, even in well-organized start-ups, some systems become orphaned over time, sometimes silently, through organization restructuring and organic attrition.

To validate how much clarity teams have over their ownership boundary, the startup can review the systems they have and existing ownership assignments. In many organizations, this information would already be maintained as a durable asset, such as a service catalog, which should be reviewed with teams to validate its currency.

Organizations without such a service catalog could start by taking a snapshot of their technology landscape (listing out or visualizing systems, for example with the C4 model) and working with teams to tag each component with its respective owner. In the longer term, it would be best to move this towards a living artifact like a service catalog (even a lightweight one – a document instead of a full-blown portal) as well.

Ideally, through that process, any identified orphan systems will have been assigned an owner. In reality, it is reasonable to prioritize based on the business criticality, cost impact, or other dimensions.

Team leaders (engineering manager, tech lead, product lead) will then need to be held accountable over costs of the systems their teams own. This could initially be an expectation that they review costs at a reasonable cadence - which can be weaved into their existing rituals (monthly sync-ups, quarterly review, etc.). Eventually, cost measures should be embedded into the KPIs of these teams.

Putting cost front and center builds organizational muscle and helps to send the message that everybody should think about the cost implications of their decisions, and that managers are accountable for it, the same way we think about security and quality.

However, just like with security and quality, the company needs to be aware of the second order effects of cost considerations. Teams should not be frugal to a fault; they can consult relevant company leaders to help them make decisions on cost. Often, at a startup it makes sense for teams to take on tech debt that incur additional costs if it means faster time to market, especially for experimental features. The trick is to have the discipline to spot when costs are trending up and course correct.

While it is critical to federate accountability to team level, some cost management actions, such as negotiating bulk purchase commitments, and optimizing overall technology portfolio, can only be done optimally by taking into account broader organization context. Therefore, cost accountability also needs to be assumed across teams, at product group level.

Make cost visible

To support the desired level of federated accountability, the cost of running systems need to be reported and attributed to the owning organization levels (teams, product groups). ​​The way to achieve this depends on the type of service. For example, cloud infrastructure or services can be attributed to their owners with a tag hierarchy, whereas workloads running on shared Kubernetes clusters can be attributed back with labels, namespaces, or service names (Kubernetes-specific cost monitoring tools allow breaking down cost of shared Kubernetes clusters to teams based on labels, namespaces, and service names).

While perfect attribution of every service or infrastructure component to the product or team is hard to achieve, it is critical to keep the reports discoverable, understandable, and actionable, allowing engineers to understand the cost implications of their technical decisions and leaders to see if any course-correction is needed.

The level of detail in these reports is important. When the audience is closer to the team level, it's helpful to have finer-grained data and to have the reports updated more frequently. Teams make decisions that affect costs during their day-to-day development work, so having reports on a bi-weekly or monthly basis gives them a faster indication to change direction compared to quarterly reports.

For leaders above team level, the focus is on detecting larger trends and understanding if any changes in contract structures or technology strategy is needed. The reports may aggregate costs across different dimensions such as the ones covered in Understand primary cost drivers, but the report generally does not need to be as frequently-updated as team-level reports.

Make it easier for teams to do the right thing

An often overlooked part of cost management is making it easier for people to do what is expected of them, which is to be accountable for cost for their part of the tech landscape. Rather than create a heavy handed governance process, seek to enable desired behavior and outcomes. If the easiest way is the most cost efficient, technologists will naturally follow best practices.

To create an environment where it is easy to achieve the desired outcomes, we can use nudges. Richard Thaler discusses this topic in detail in his book Nudge. One example he uses that is good analogy to limitless self-service compute is: “Trayless cafeterias. Cafeteria managers have been taking a keen interest in reducing food waste. Seeing how easy it is to load up a tray with extra food that often goes uneaten and extra napkins that go unused, curious managers and students at Alfred University in New York tested a trayless policy over two days. When trays weren’t offered, food and beverage waste dropped between 30 and 50 percent!”

The Backstage developer portal is a good example of a tool that nudges people to do the right thing. The use of templates nudges engineers to the Golden Path (Spotify’s version of a paved road). It also has scorecards on documentation to nudge engineers to add attributes that make them more useful and readable.

Here are examples on applying nudges to improve cost efficiency:

Desired Behavior

Nudge

Teams consider cost when making engineering decisions

Make team-level cost metrics easy to find and understand. For example, one client sends their teams regular reports on cost trends and outliers. One team managed to save about $100k a month by investigating an outlier in that report.

Put cost in the standard list of considerations in design document templates / Architecture Decision Record templates, even story cards. One of our infrastructure teams created a special required Jira tag on their cards that indicates the estimated cost impact (in T-shirt sizes - S/M/L) for the work.

Teams tag consistently (consistent spelling, no typos) and keep tags up-to-date

Give teams a few choices rather than keeping tag values free-form when creating infrastructure.

Make it easy for them to change the tag in case teams change or product moves hands by automating the tag change.

Send teams periodic reminders to review and update tags or even do a quick review with the teams in a regular cadence and get feedback from them.

Add linter rules which ensure tags follow naming conventions.

Teams do not pick high-costing VMs

Narrow their choices by giving them a few sensible default instance types. For example, in the Databricks case study above, we used Databricks cluster policies to limit instance types engineers can select. If using VM’s for development or data scientist work, have a default machine that is easy to setup.

Show them the cost impact of their changes, e.g. with tools that show cost impact of Terraform code PRs.

Teams use tools already contracted with the company

Utilize service or infrastructure templates (paved road) that are easily accessible by team.

Create a centralized catalog of the tech stack the company uses, for example using your own custom version of the Tech Radar.

Review and govern technology portfolio

An organization’s technology portfolio consists of its in-house systems and third-party tools, languages, and frameworks. The more items in the portfolio, the greater the scope of responsibility for the organization, resulting in higher costs both in terms of financial investment and cognitive burden. While each single item in the technology portfolio was initially introduced for a specific reason, these reasons can become invalid or irrelevant over time. Governing the technology portfolio in a way that reduces fragmentation therefore helps reduce costs.

The first step to governing a startup’s technology portfolio is to take an inventory of the systems it has and the capabilities of each. In doing this, it becomes easier to identify overlapping functionality and identify redundant systems or tools. For instance, multiple systems within the portfolio may have their own implementations of a CMS, or the startup may discover that across teams, there are multiple tools in use to provide CI/CD capabilities.

Once the latest state of the portfolio is well-understood, our teams frequently rely on a couple of tools to help with portfolio optimization.

A Wardley map enables engineering leaders to visualize technology capabilities supporting the business, how visible they are to users/customers, and the stage of evolution they are in (whether they are experimental, or fairly mature but custom/specific to the business, or a commodity). This opens up conversations about how differentiating these capabilities are to the business and whether any shifts in investment is needed. The Wardley map has helped teams in reviewing their portfolio and identifying capabilities that were developed and still maintained in-house, even though a lower-cost “buy” option has become more compelling over time.

Another tool we like is a technology radar for languages and third-party tools and platforms.

Technology Radar itself is a Thoughtworks industry publication, but the model has been used by multiple organizations such as Zalando to communicate a consolidated landscape of languages and tools. By communicating to engineers within the organization what the safe language/tool choices are, what’s not recommended for use, and what technologies are in various stages of experimentation, it nudges engineers along the desired path, discourages fragmentation, and in turn helps reduce costs. There are multiple ways to get going with a custom technology radar, such as through the Build Your Own Radar toolkit or the Backstage Tech Radar Plugin.

When considering changes to the technology portfolio or any major architectural changes, it is important to conduct a financial analysis on the potential return on investment (ROI) with your financial partner. The main considerations in the financial analysis are the cost of labor of implementing the change, the cost of the tool itself if being replaced, and the potential efficiency gains or losses because of the new approach, and the cost of maintaining the status quo. This analysis has to span the organization in terms of labor and impact as it isn’t just the team that is implementing the change that could be impacted.

A client of ours considered moving to a new observability tool as the cost variability of the current tool was worrisome and the tool was cumbersome to manage. After careful consideration, which included a quote from a new vendor, estimate of expected labor costs, and analysis of cost reduction in the timeframe they chose, the client decided to keep with the current tool as the ROI was negative.

Optimize rates

Cloud and SaaS service providers reward their customers for commitment (e.g. reserved instance or savings plan purchases) and scale. However, bulk purchasing plans can become liabilities if actual usage doesn’t match estimates. Longer term commitments represent increased risk, since a company’s system, users, and market opportunities evolve and change faster than its contract terms. One client of ours had signed up for a three year commitment with AWS (compute savings plan) but then a year later decided to decommission one part of their system, which resulted in the committed plan being underutilized.

The reverse is also true: if the company always under-commits, it is always paying a higher price for the resources. This requires a careful balance and continued conversation with business on how they want to manage this risk.

Most SaaS products assign companies an account manager who should be able to tell them what kind of contract structures are available to them to get the best price. It never hurts to ask for a discount. Some SaaS providers give discounts in return for intangible benefits, such as being a referenceable client or providing feedback on beta versions of their product. We recommend to regularly meet with the account manager as they keep track of the company’s usage and will notify them if there are better options.

Consolidating responsibility over rate optimizations for the organization (or department) enables a more efficient purchasing strategy than federating responsibility across multiple teams. The scale of the organization may justify investment in a FinOps team to manage the pricing models which best enable economies of scale across the company.

Example cost efficiency initiatives as the company grows

Phase 1

Experimenting

Limited funding - the company focuses on finding product market fit.

The infrastructure and technology landscape is kept lean, but cost efficiency is not a primary focus.

Phase 2

Getting Traction

The company focuses on building features to capture market share.

Cost efficiency considerations are deferred while gaining market traction.

The company starts to split off into sub-teams, but still thinks of itself as “one big team” and shares infrastructure.

Phase 3

(Hyper) Growth

Cost increases proportionally to growth, or even outpaces growth.

First platform team is assembled to reduce friction in infrastructure and observability setup.

Platform team starts tracking costs against teams or products with tagging.

Leadership monitors macro cost trends, performs low hanging fruit such as optimizing contract rates, but may not trigger larger cost optimization efforts yet.

Phase 4

Optimizing

Leadership sees signs that cost levels are starting to become concerning.

An initiative and a driving team gets created to get costs under control, working with individual product teams.

Leaders start setting expectations on cost discipline and set up federated accountability for costs.

Costs are made visible to owning teams/products with product/team-scoped cost dashboards.

Platform team(s) set up nudges to direct engineers to do the right thing for cost tracking and efficiency by default.

Summary

Cost frequently becomes a bottleneck for scale-up business models, which is a common trigger for the organization to enter an optimization phase. By taking a proactive approach and tackling cost head-on in this phase, the organization can position itself for sustained growth.

Our key recommendations were

  • Identify main drivers of the cost bottleneck by analyzing cost trends broken down by a few dimensions such as system, compute vs storage vs network, and pre-production vs production
  • Create a cross-functional cost optimization team and use a tactical Reduce phase to identify, prioritize, and execute common levers to quickly reduce costs
  • After the initial reduction of costs, shift focus to the Sustain phase to make lasting changes to avoid operating costs becoming a problem again in the future
  • Hold teams accountable for cost efficiency of the custom and third party systems they own, while enabling them to do so by providing them actionable and timely cost reports for their systems
  • Examine the organization’s technical portfolio for opportunities to consolidate redundant or obsolete systems and more effective use of third party software
  • Utilize nudges to guide teams to make optimal choices
  • Establish a regular meeting cadence with vendors to ensure a competitive price and receive insights on best practices of tools.

Fundamentally, each of the tactics and strategies we have covered enable visibility and promote ownership and action across the organization.

Without a continued focus on the problem through delegated responsibility to empowered teams, the organization will quickly find itself right back where it started - facing cost efficiency challenges due to inadequate fiscal controls within the company.


Acknowledgements

This article improved dramatically from the comments and suggestions from many of our colleagues. Our thanks to Martin Fowler, Ajay Chankramath, Tim Cochran, Vanessa Towers, Kennedy Collins, Karthik Krishnan, Carl Nygard, Brandon Byars, Melissa Newman, Nic Cheneweth, and Sagar Trivedi.

Significant Revisions

17 August 2023: published final installment

15 August 2023: published first part of sustain phase

10 August 2023: published reduce phase

01 August 2023: published case study

31 July 2023: Published signs.