
The Rise of Test Impact Analysis
Test Impact Analysis (TIA) is a modern way of speeding up the test automation phase of a build. It works by analyzing the call-graph of the source code to work out which tests should be run after a change to production code. Microsoft has done some extensive work on this approach, but it's also possible for development teams to implement something useful quite cheaply.
22 August 2017
Paul Hammant is an independent consultant helping clients with Continuous Delivery and DevOps. He played a leading role in developing tools and techniques for Trunk-Based Development and Dependency Injection. He's been a senior staff member in several technology organizations including a twelve year stint at Thoughtworks.
One curse of modern software development is having “too many” tests to run all of them prior to check-in. When that becomes true, developers use a costly coping strategy of not running any tests on their local developer workstation. Instead they rely on tests running later on an integration server. And quite often even those fall into disrepair, which is inevitable when shift right becomes normal for a dev team.
Of course, everything that you test pre-integrate should immediately be tested post-integrate in the Continuous Integration (CI) infrastructure. Even the highest functioning development teams might experience breakages born from timing alone for commits landing in real time. Those teams might also harbor someone who sometimes wants to 'economize' on the agreed integration process and NOT run tests. Luckily, CI servers and a decent series of build steps are how you quickly catch those moments.
Various techniques exist to speed up test execution, including running them in parallel over many machines and using test doubles for slow remote services. But this article will focus on reducing the number of tests to run, by identifying those most likely to identify a newly added bug. With a test pyramid structure, we run unit tests more frequently because they usually run faster, are less brittle and give more specific feedback. In particular, we frame a suite of tests that should be run as part of CI: pre-integrate and post-integrate. We then create a deployment pipeline to run slower tests later.
The same problem restated: If tests ran infinitely quickly, we would run all the tests all the time, but they are not, so we need to balance cost vs value when running them.
In this article, I detail an emerging field of testing-related computer science where Microsoft is leading the way, a field that companies with long test automation suites should take note of. You may be able to benefit from Microsoft's advances around “Test Impact Analysis” immediately, if you are in the .NET ecosystem. If you are not doing .NET, you have to be able to engineer something yourself fairly cheaply. A former employer of mine engineered something themselves based on proof of concept work that I share below.
Conventional strategies to shorten test automation
To complete the picture, I will recap the traditional “run a subset of the tests” strategies, that remain dominant in the industry. Well, with the newer reality of parallel test execution and service virtualization.
Creation of suites and tags
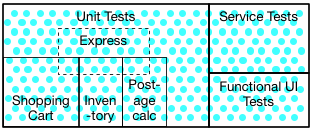
Major groupings of unit, service and functional UI. Within unit tests, tags for meaningful sub-groupings, including one 'express' that samples a subset of the the others.
After 'Shopping Cart' tests were run, all bar one passing. here.
This approach works with recursive build technologies such as Ant, Maven, MSBuild, Rake, and alike.
Historically, teams would give up on making their tests infinitely fast, and use suites or tags to targeting a subset of tests at any one time. With the creation of suites and tags, a subset of tests can be verbally describable. For example “UI tests for the shopping cart”. Tags or suites could allude to business areas of the application, or to technical or tiered groupings. Defining tags and suites requires expert human design creativity. At least in order to push towards optimal groupings. That implied that they could be insufficiently, inexactly, and incorrectly grouped too, which is common enough, even if difficult for humans to determine. Too few and too many tests executed at the same time is a strong possibility for running one suite only - a wasteful use of computing esources and time, that also risks letting a bug slip through. Teams might choose to have CI jobs that use a smaller suite per commit, and then also a nightly build job that runs all tests. Obviously that delays bad news, and defeats the aims of Continuous Integration.
Suites and tags, however, is the way the majority of the software development world has organized its test code-base.
Pre-calculated graphs of source vs tests
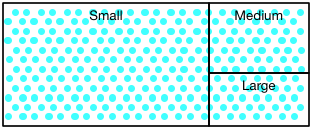
276 tests with their notional 'size' designations.
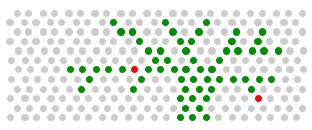
The ones executed for given commits, with two failures resulting. As it happens, some of those turn out to be small, some medium, and some large. I have only depicted a tree/fractal because it helps explain the concepts (it is not really like that).
Google's fabled internal build system Blaze, has been copied into a few open source technologies over the years. Most notable are Buck from Facebook and Bazel from Google. Pants by Twitter, Foursquare and Square. Blaze inside Google navigates a single directed graph across their entire monorepo. Blaze has a mechanism of direct association of test to production code. That mechanism is a fine grained directory tree of production sources and associated test sources. It has explicit dependency declarations via BUILD files that were checked in too. Those BUILD files could be maintained and evolved by the developers, but could also be verified as correct or incorrect by automated tooling. That process repeated over time goes a long way to make the directed graphs correct and efficient.
Importantly, that tooling could point out redundant claims about dependencies. Thus for a given directory/package/namespace, the developer could kick off a subset of the tests quite easily - but just the ones that are possible via directed graphs from the BUILD files. The ultimate time saver, both for the developer pre-integrate and the integration infrastructure, was scaled CI infrastructure 'Forge' (later TAP), was the automated subsetting of tests to run per commit based on this baked-in intelligence.
There are a bunch of mind-blowing stats in Taming Google-Scale Continuous Testing. In my opinion this stuff has cost Google tens of millions but made them tens of billions over the years. Perhaps far greater than the earnings:wages ratio.
Test Impact Analysis
Test Impact Analysis (TIA) is a technique that helps determine which subset of tests for a given set of changes.
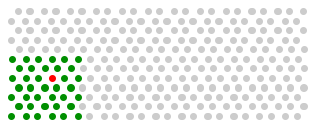
A similar depiction for tests to run for a hypothetical change.
The key to the idea is that not all tests exercise every production source file (or the classes made from that source file). Code coverage or instrumentation, while tests are running is the mechanism by which that intelligence is gleaned (details below). That intelligence ends up as a map of production sources and tests that would exercise them, but begins as a map of which productions sources a test would exercise.
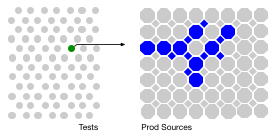
One test (from many) exercises a subset of the production sources.
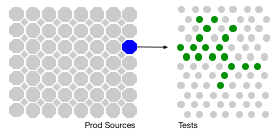
One prod source is exercised by a subset of the tests (whether unit, integration or functional)
So you will note that the stylized diagram of executed tests, is the same as for the Directed graph build technologies above. It's effectively the same, as the curation of the BUILD files over time leads to more or less the same outcome as TIA.
The TIA maps can only really be used for changes versus a reference point. That can be as simple as the work the developer would commit or has committed. It could also be a bunch of commits too. Say everything that was committed today (nightly build), or since the last release.
One realization from using a TIA approach is that you have too many tests covering the same sections of prod code. Of those are straight duplicates, then deleting tests after analysis of the test and the paths through prod code that it exercises, is a possibiity. Often they are not though, and working out how to focus testing on what you want to test, and not on at all on transitive dependencies in the code is a different focus area that inevitably rests on the established practice of using test doubles and more recently Service Virtualization (for integration tests).
The minimal level of creating a list of what has changed is “Changed production sources”, but the ideal would to determine what methods/functions have changed, and further subset to only tests that would exercise those. Right now though, there is one ready to go technology from Microsoft that works at the source-file level, and one reusable technique (by me). Read on.
Microsoft's extensive TIA work
Microsoft has put in the longest concerted effort to productionize Test Impact Analysis ideas, and gave the concept that name and its acronym.
They have a current series of blog entries that span March to August of 2017, so far: Accelerated Continuous Testing with Test Impact Analysis - Part 1, Part 2, Part 3, and Part 4.
Their older articles on this go back eight years:
- Test Impact Analysis in Visual Studio 2010 (2009)
- Streamline Testing Process with Test Impact Analysis) (2010)
- Which tests should be run since a previous build? (2010)
- How to: Collect Data to Check Which Tests Should be Run After Code Changes (2010)
- Test Impact Analysis (2011)
Microsoft's Pratap Lakshman detailed the evolution of their implementation. Concerning the current evolution of their TIA tech, Pratap says:1
1: These extracts are from an email exchange that I had with Pratap.
The map of the impacted tests versus production code is recalculated when there is a build that is triggered. The job to do that runs as part of the VSTest task within a VSTS build definition.
Our TIA implementation collects dynamic dependencies of each test method as the test method is executing.
At a high level here is what we do: As the test is executing it will cover various methods – the source file in which those methods reside are the dynamic dependencies we track.
So we end up with a mapping like the following:
        Testcasemethod1 <--> a.cs, b.cs. d.cs
        Testcasemethod2 <--> a.cs, k.cs, z.cs
and so on …
Now when a commit comes in to say a.cs, we run all
Testcasemethod(s) that had a.cs as
their dynamic dependency. We, of course, take care of newly introduced tests (that might
come in as part of the commit) and carry forward previously failing tests as well.
Our TIA implementation does not do test prioritization yet (e.g. most often broken first). That is on our radar, and we will consider it if there is sufficient interest from the community.
The actual TIA map data is stored in TFS as in an SQLServer database. When a commit comes in, TIA uses TFVC/Git APIs to open up the commit and see the files into the which the changes are going into. Once it knows the files, TIA then consults the mapping to know which tests to run.
Of course, usage of this TIA technology is supported in pull request (PR) and regular CI workflows, as well as pre-integrate on the developer's workstation.
We want our users to embrace the Shift Left and move as many of their tests to earlier in the pipeline. In the past we have seen customers a little concerned about doing that because it would mean running more tests at every commit, thereby making the CI builds take longer. With TIA we want to have our users Shift Left and let TIA take care of running only the relevant tests – thereby taking care of the performance aspect.
Concerning the first few years of TIA inside TFS and Visual Studio, he says:
The TIA technology at that time was quite different in many ways:
- It would only identify impacted tests. it was the left to the user to explicitly run them.
- It used block level code coverage as the approach to generate the test <--> mapping. In the subsequent build, it would do an IL-diff with the earlier build to find out blocks that changed, and then use the mapping to identify and list impacted tests. Note that it would not run them for you.
- The above approach made it slow (compared to the current implementation), and required way more storage for the mapping information (compared to the current implementation)
- The above approach also caused it to be less safe than the current implementation (it would miss identifying impacted tests in some cases).
- It did not support the VSTS build workflow (it was only supported in the older XAML build system)
Test Impact Analysis via conventional code coverage tools and scripting
I had an idea to co-opt modern, off the shelf, code-coverage tools into the same impact analysis when I worked at HedgeServ. From that idea, I made two proof of concept blog entries (with the associated code on Github): One for Maven & Java2, and one for Python3. Of course, like an eejit, I thought I had a novel invention, but I did not know at the time that there was a quite a bit of prior-art in this space (Microsoft above). The technique I've shown is cheap to develop within your tool chain, even if it may have a cost to run within your CI infrastructure.
2: Previous Blog entry: Reducing Test Times by Only Running Impacted Tests - for Maven & Java.
3: Previous Blog entry: Reducing Test Times by Only Running Impacted Tests - Python Edition.
A simple implementation of the idea of Test Impact Analysis requires that you have one up front activity:
- Run single test and collect code-coverage for it
- From the prod source files touched for the test, make a temporary map of the prod sources (key) to test path/name (value)
- Update the source files that contain the master map, replacing all previous entries for that test
- Commit those changed map source file to VCS (only the CI job in question should have permission to do this)
- Clear the coverage data (so as to not entangle coverage reports per test)
- Go back to #1 for the next test (most recently changed sources/tests first?)
After running all the tests one at a time you have a comprehensive map connecting prod code to the tests that cover them.
Then when you later make changes to some prod code, you can figure out which tests exercised that code, and are thus likely to be informative when run. Any test failures produced are provably the only test failures that could happen from the changes made. The two proofs of concept referred to above contain a small amount Python code that attempts to:
- Calculate TIA maps ahead of need
- Use TIA maps in a pre-integrate situation (with small modifications it could be used in CI jobs too)
HedgeServ's test-base is comprised of regular speedy unit tests, followed by integration tests that are Microsoft Excel spreadsheets which in turn indirectly invoke Python. There are 12,000 of them. Those tests are many hours of extensive and advanced algorithm tests that would be impossible to do per-integration in CI infrastructure without some “run less of them” strategy. Their DevOps team operationalized the proof of concept as “Test Reducer” (the initial name I gave this tech), and the quickest permutations are now ten minutes. A fantastic improvement. Developers and Test Engineers can run them pre-integrate, and the CI infrastructure can do the same. HedgeServ's Managing Director of Software Development, Kevin Loo, tells me that “developers count on the quicker test runs, and the pace of development has increased because of an increased confidence”.
Because generic code coverage tools are being used the TIA aspect has to be run one test at a time, which has an up front cost. For that reason, the map that results from the analysis is checked into source-control and incrementally updated. It, therefore, has to be text and ordered in nature so that the diffs can be terse and have some meaning. Checking the map into source control also benefits the CI infrastructure and the individual developers looking to run fewer tests prior to integration (and code review).
This TIA design has a limitation because of the nature of code coverage tools: Only one test can be run at a time in order for an accurate impact graph to be calculated. In order to use the map data, there is a need run “git status” (or git show >hash>) and then parse the output to find the 'changed/added/deleted' production code sources. And those are the keys to the impact map, that result in a list of tests to run. It is only the data gathering CI job that has the limitation of “one test at a time”, which is why you more or less consider it perpetually running.
The testing technology, as you see, can be totally alien to your main language choices for the prod code. In HedgeServ's case, their algorithmic tests were in Microsoft Excel files under source control (that even the BAs contributed to). If that is possible then so are SmartBear's TestComplete, HP's Unified Functional Testing (UFT - formerly QTP), and of course Selenium. The only requirement is that tests can be scripted to run one at a time (while you build the TIA map). You are also going to have to commit to updating the map at some frequency following its initial creation - use your CI infrastructure.
You are then left with a decision as to where to store that map data. You could choose a file share, or a document store, or a relational schema. I chose (and would recommend) text files in a directory that's in the same repo/branch as the prod source itself. That at least allows branching to work (whatever your branching-model) and have divergent impact maps perhaps reflecting the divergent nature of the code.
For a client recently, I was looking at a project that uses KDB and Q for its system and trying to advise them on how to bring down test times. There is no code coverage tech for these, so that was the end of that conversation.
VectorCAST/QA - application
Vector Software has made a product called VectorCAST/QA that is a one stop shop application that leverages code-coverage in the same way to run fewer impacted tests (and more). Their technology is mostly sold to the automotive (and related) industry that embeds C, C++ and Ada software. VectorCAST working in this mode of operation also predates my kitchen sink experiments. I have to work on my googling skills!
NCrunch for VisualStudio
NCrunch for .NET teams was launched in 2011 after a couple of years of development. It is a sophisticated plugin for Visual Studio that can optimize the run order of tests based on algorithms that predict which are most likely to break for a change. In 2014 extra features were added to allow it to subset tests to just ones impacted by the change. Also in 2014, NCrunch became compatible with CI usages generally. Specifically it was able to orchestrate executions of MsBuild outside of the VisualStudio UI, with the same elapsed-time savings that you would hope for. The raw impact map data isn't stored in source control as it is binary, but can be shared between developers and CI infrastructure on a network share. NCrunch is commercial, but for a reasonable per-developer (and per test-engineer) license fee. CI nodes are free, and NCrunch's creator, Remco Mulder, agrees that nobody should pay twice for something or be penalized for having scaled their CI infra via Docker and alike in 2017.
TIA support in IDEs
Microsoft also has a powerful Live Unit Testing4 feature in Visual Studio that, if enabled, automatically runs impacted unit tests even as you edit the code. While related to TIA, this is perhaps worth a separate analysis.
4: Article: Live Unit Testing with Visual Studio 2017 on Microsoft.com.
Last month I thought I would raise a feature request for JetBrains to equivalent create TIA functionality to their IDEs. During the triage of the ticket I had raised, JetBrains connected it to another one from 2010 on the same topic, and in that one there was a suggestion that some of this functionality is already implemented. I could not get it working when I tried it though ☹️
Definitions
Pre-integrate and post-integrate
Pre-integrate activities are those that developers do on their workstation, that may include local (hopefully short lived) feature branches, little commits (that may or may not be squashed into one later, and editing/building cycles before a declaration of “done” for the story card in question. It is definitely before the commit/commits are passed into code review, etc.
Post-integrate is the stage where that work (one commit or more) has completed code review and is going back into the trunk/master/mainline. Soon after that, all team mates will be able to pull it to their workstations, and probably should.
Shift left and right
Shift left is a process of taking a step that's part of the value stream of software development and moving it up the timeline. Taking manual testing, and replacing it with test automation is an example. Another is defects caught in a product owner's head before being typed into the backlog (a story tracker). In that case the defect is a product idea that would become a feature request in the tracker - that would be ultimately judged to be incorrectly specified - not a bug as such. That could be accidental, but if you put in place a new process to do that, it would be part of a shift left agenda. Barry Boehm's “cost of change curve” speaks to the larger topic - mistakes are cheaper to fix the sooner you catch them and are most expensive to remediate when found in production. As it happens, 'shift left' is a minor industry cause. Enterprises are using it to describe an alternate way explaining questing for cheaper and quicker. The same goals as continuous integration, in particular, and Agile, CD and all that generally.
Shift right is when you do un-agile things like moving unit test execution to a “nightly” build (or less frequently) instead of making them faster in the per-integration CI build. Sometimes you have done a bunch of shift left activities that come with some risk, which can only be mitigated by an additional sift-right step.
Historical work in this space
Google-Testar (2006)
Mikhail “Misha” Dmitriev made Testar while at Google in 2006.
Misha's goal: don't run all the tests, while simultaneously claiming “we can empirically prove we do not have to”.
Testar uses bytecode instrumentation to record code coverage for each test - that is, which application methods are exercised by each test. This information, along with checksums for classes and methods, is saved into the Test Database (TDB). On subsequent invocations, Testar finds out what classes and methods the developer has changed, and then re-runs only those tests that cover the updated code. It is assumed that other tests, that passed before, will pass again since the code that they exercise hasn't changed. Of course, if any test didn't pass before, or has just been added, Testar will run it unconditionally.
Misha reported average 60..70% time savings due to not running “unaffected” tests. However, this technology is not problem-free. First, savings are inconsistent: for example, if a developer repeatedly changes a method that is used by most tests, the savings will be small. Second, if test outcome depends not only on the code but also on some external input, such as resource files, the user needs to explicitly specify all these files to Testar. The tool cannot automatically determine which tests depend on a given resource file, and can only re-run all tests or those explicitly specified by the user.
Misha's reflections here: 5
5: These comments, and the other contributions in this appendix, are from emails with the various contributors.
At that time the off the shelf libraries for bytecode instrumentation were less sophisticated, and/or there was a lack of flexibility with them. I found quite often that unless some library is top quality, it makes more sense to write a bit more of my own code upfront and then have much more freedom later.
Misha on his experience at Google and other companies:
I eventually concluded that a technology like Testar may not be the best option if a company runs a wide variety of tests, and has enough hardware resources. In this scenario, running all tests with a high degree of parallelization is more reliable. However, fine-grain selective test execution as done by Testar may still work in niche cases. For example, when individual tests take extremely long and cannot be sped up by parallelization or other techniques, or when there are limited hardware resources but there is no problem with resource files and other non-code input for the tests, etc.
It seems to me that Testar could be rejuvenated, if somebody wanted to give it new life. Also, Testar is the first technology to do TIA that I could find, but was based on a paper that was presented at a conference that talked about the concepts. Misha says he can't locate that paper today.
ProTest: brittle tests should fail sooner
In 2007 some Thoughtworks colleagues Kent Spillner, Dennis Byrne, Naresh Jain and others open sourced Protest that sought to run the tests most likely to break first. Most likely was a combination of historical breakage stats, and whether the prod or test source was currently being changed or not. Recently changed prod source files had impacted tests, which became candidates for prioritization. Changed tests would be candidates too. The intersection of the historically brittle and the recently changed would be the tests that a custom JUnit test runner, would execute first. The pertinent build step would take the same amount of time over all, but the test failure news can be issued sooner. That is because CI technologies do not wait for the end of the build step to communicate failure as they are listening to the log events on a per test basis, or scraping the log output. The same is true of the runners that are integrated into IDEs (Intellij and Eclipse).
Naresh remembers:
We built an AST and then used the visitor pattern to walk through the code and collect interesting stats. In terms of steps ProTest did:
- At the launching of tests stage, ProTest processes the bytecode of tests and prod classes to build a map of prod-classes versus tests
- It calculates the changes in the working copy, based on source file time stamps
- From those changes, it works out smallest set of tests it has to run and runs them first
- Test reports issued as normal, and a consequential pass/fail for the set
Dennis adds:
Kent wrote an extension point for any pluggable algorithm you wanted to use based on the Condorcet voting strategy (each voter must rank all candidates). I wrote a bunch of bootstrap algorithms. One of them used ASM to build a dependency graph and then sorted tests based upon how close they are to whatever changed. We never got to version 1.0 though 🤔
Kent sees ProTest like so:
The map wasn't retained between invocations, as it didn't need to be, the calculation of which tests should be run was consistent and very quick. The closest thing I've ever seen to ProTest was Kent Beck's JUnit Max, but that was probably a few years after Dennis came up with the idea for ProTest. I wish we had done more to finish ProTest. To this day I frequently find myself still in situations where I could really use something like it. I know Naresh subsequently recruited some more people to continue working on it, but that effort also stalled. Maybe someday someone else will pick up the mantle and carry-on. That's the beauty of open-source, right?
JTestMe: “Just Test Me”
Also in 2007, some other Thoughtworks colleagues Josh Graham, and Gianny Damour worked on an open source tech called JTestMe that used AOP to build a repository of production classes versus tests that would exercise them. It was very similar to ProTest in that it was also wanting to prioritize tests more likely to fail.
Josh recalls:
The reasoning behind using runtime call analysis was that, although static analysis was useful for Java, it doesn't reveal everything on a platform with reflection capabilities and one that encourages other languages, including those where static analysis was less straightforward (JRuby, then, for example, and also Clojure nowadays).
The proof-of-concept was simple and fast. It created a point cut on all JUnit test methods (i.e. test cases) during the running of the test suite. That point cut advised whenever a non-private method of any non-test class was called. That advice then recorded the source file name of the class and the test executing at the time.
With this map of source code file names to test cases, any time the source code file was changed, it was known which test cases needed to be run. I called this a “dynamically defined smoke test“. On a CI server, the revision information was extracted and used to query the map to ascertain which test cases could be run first. On a developer's local machine, an inotify-based tool notified when a source code file changed and the test cases that touched that class were run in a side process. In an IDE I used the excellent Infinitest with a custom list (being continually updated by a query to JTestMe). The map itself was a simple Java object serialization to a file. It could be committed to source control as it would go on to save the CI redoing it between builds, which could be quite a problem on agent-based builds.
I chose load-time weaving so the test suite could be run with or without instrumentation (in case somehow the AOP tool created false test outcomes).
The obvious drawback with the approach is that when a new test case is created (often in a TDD team), it isn't included as a smoke test candidate until it is instrumented, so there were some straightforward but cumbersome command line changes in a few places in the development pipeline. Standard tooling that was more in tune with this sort of approach would attract more teams to the benefits. Alas, precise specification and verification remain a very undervalued asset in teams swamped with cargo-culting and chasing buzzwords.
As an aside, the team building “Clover” (soon after acquired by Atlassian) did something similar to the ProTest static analysis approach.
Wallaby.js: Continous testing for JavaScript as you type
Wallaby.js is a commercial Integrated Continuous Testing tool for JavaScript that runs tests immediately as you type and displays execution results (including the code coverage, error and console messages) right in your IDE/editor. It also provides some pretty test and code coverage reports updated in real-time. To run tests as fast as possible it uses a combination of static/dynamic analysis and numerous heuristics, along with test parallelization. The complexity for Artem Govorov, who makes Wallaby, is that test frameworks and transpiled languages all require analysis and support in order to keep everything compatible. Wallaby is also for IDEs/editors only, and it prioritizes to the code that is actually being worked on. It is not aware of Git or any VCS controlling the underlying source files and therefore does not subset the tests using TIA. That said, nobody has ever built a suite of pure JavaScript tests where “run them all” was not quick enough anyway.
Footnotes
1: These extracts are from an email exchange that I had with Pratap.
2: Previous Blog entry: Reducing Test Times by Only Running Impacted Tests - for Maven & Java.
3: Previous Blog entry: Reducing Test Times by Only Running Impacted Tests - Python Edition.
4: Article: Live Unit Testing with Visual Studio 2017 on Microsoft.com.
5: These comments, and the other contributions in this appendix, are from emails with the various contributors.
Significant Revisions
22 August 2017: Updated to include NCrunch and Wallaby.js
07 August 2017: First published