
QA in Production
04 April 2017

Rouan is a software engineer and technical leader, who helps build outstanding teams and high-quality software. He's worked in a variety of technology stacks for companies in the financial services, education, leisure and energy sectors (including as a consultant at Thoughtworks). He cares about keeping things simple, building inclusive teams, and writing about what he learns.
Gathering operational data about a system is common practice, particularly metrics that indicate system load and performance such as CPU and memory usage. This data has been used for years to help teams who support a system learn when an outage is happening or imminent. When things become slow, a code profiler might be enabled in order to determine which part of the system is causing a bottleneck, for example a slow-running database query.
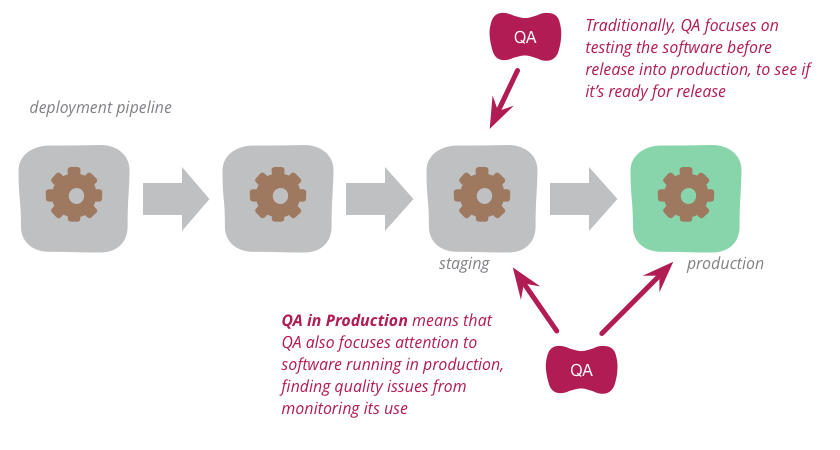
I’ve observed a recent trend that combines the meticulousness of this traditional operational monitoring with a much broader view of the quality of a system. While operational data is an essential part of supporting a system, it is also valuable to gather data that helps provide a picture of whether the system as a whole is behaving as expected. I define “QA in production” as an approach where teams pay closer attention to the behaviour of their production systems in order to improve the overall quality of the function these systems serve.
Things always go wrong in production, but this doesn’t have to be a bad thing. It’s an opportunity to learn about your system and the real world with which it interacts. With the right production monitoring tools and a good Continuous Delivery pipeline, you can build a set of feedback mechanisms that help you find out about issues as they happen and ship fixes quickly. Adopting production QA (Quality Assurance) practices can help you gain a richer understanding of the real issues your system faces and learn new ways to improve its quality.
Gathering production data
There’s a lot of data you could be gathering about your system. I’ve found it very helpful to think about what is critical to the success of a system and to let this guide my efforts. When I talk about success in this context, I’m referring to the kind of things that pay the bills. It doesn’t matter if your system serves thousands of requests per second if it fails to provide a service that your customers pay for or rely on.
Critical success indicators
At Tes, I’ve spent some time working on a system teachers use to apply for jobs. One metric that our team identified as critical is whether a teacher’s job application actually reaches the school for which they apply to work. Email is the primary method via which the system notifies schools of new job applications. We use a third-party service to send emails, which means that this sits outside the boundaries of the system we’re working on. As we’ve come to learn, many things can go wrong when trying to send an email. Email addresses can be invalid even when they seem valid, mailboxes get full and people have out-of-office messages which can make it seem like they didn’t receive an email even when they did. These kinds of real-world complications are almost impossible to predict and hard to test. What we did instead was to learn from what happened in production. Here’s a summary of how our understanding of, and reaction to, the quality of the system evolved:
- We started counting the number of job applications submitted and the number of emails we sent (by sending simple metrics to a metrics server). We set up an alert so that we got notified whenever these numbers were out of sync.
- We set up another alert that let us know if our email-sending microservice was unable to process a request to send an email.
- It turned out that this happened frequently. Our alerts were firing, but it wasn’t clear why. We took a look at the logs, but couldn’t find any useful information, so we set about improving our logging. In particular, we logged more detail about the errors we were receiving from our third-party email provider.
- From the logs, we learned about different kinds of responses - some meant the person probably got the email despite the error (e.g. an out-of-office reply), some (like a DNS issue) could be temporary and some errors meant the email would never be delivered. Some of the documentation and error messages were confusing, so we used examples of unsent emails to speak to the schools to find out which emails did actually get received and which did not.
- We noticed that our email-sending code was too strict regarding the errors it got back, so we relaxed it a bit. (We stopped logging errors when we knew the error response meant the school is likely to have received the mail.)
- We noticed that quite a few problems were due to incorrectly captured email addresses. In these cases, we looked at the logs and talked to our customer services team. “Hi. We tried to send an email to example@example.com, but it couldn’t go through. Can you please check with the school whether the email address is correct?”
- For a while, the customer services team would let us know when an email address had been fixed, and we’d manually trigger an email resend using an endpoint we’d built on our web service. After a while, we started automatically resending emails when email addresses were updated. (We listen for updates to job information on a message queue.)
- We still had to do a lot of work to email the customer services team about email addresses that didn’t work, so we started sending these emails automatically.
- With this automatic healing system in place, we stopped alerting on every failed email, because most of them were being fixed. Now we only get alerted if a bad email address falls through the cracks and hasn’t been fixed in a certain amount of time.
Another critical usage metric for our job application system at Tes is whether teachers are actually applying for jobs. Did they hit the “submit” button at the end of the job application form or did something stop them from doing so? It might be that a small CSS or JavaScript library change has caused the “submit” button to display or behave incorrectly in a certain browser. A dip in how frequently teachers are submitting their applications may be an indication of an issue, so we are notified if something like that happens. We also keep a look out for HTTP 500 response codes returned by our service. We really want teachers to be able to apply for jobs, so if anything stops them we want to know. We’re so pedantic about this that we do whatever we can to always show them a job application form. If something goes wrong in getting the data required to show the form, we make sure we log the error and then still do our best to let the teacher apply despite the issue. We look at these logs (our alerting system reminds us to) and we deal with whatever has gone wrong. We’re of the opinion that we’d rather fix bad data or system state than disappoint a potential candidate.
I’ve mentioned a few different techniques for gathering production data in these examples. Let’s look at them in more detail.
Logging
Logging is a very powerful way of gathering data about your system, provided that you take some care in how you log data. Logs are no longer just long text files for system admins to trawl through to figure out what went wrong. If your logging stack is build with searchability in mind, it can offer you valuable real-time data about your system.
Remember that logs are not restricted to recording technical information. You can also log valuable usage data. I spent some time working on an online banking site with an excellent logging stack, where we were able to use logs to determine the popularity of new features we released. We released the ability for people to adjust their online payment limits and could quickly see that this feature was widely adopted. We could also gather some interesting data on how frequently people adjust their limits, and by how much. If you do this kind of logging, remember to keep your user’s privacy in mind and only log the data you really need.
One technique for achieving more searchable logs is to use log forwarding. This is done by having some software running on your server that will periodically send your log data to another service, usually a database that is optimised for full-text search, such as ElasticSearch or Apache Solr. By building queries on this database, it is possible to put together visualisations that show you aggregated information and trends over time. For the banking site I mentioned, it was possible to draw graphs showing interesting business metrics like how much money was being transferred, alongside more technical information like which browsers and devices users were banking on. It is also possible to search for issues and drill down into individual log entries, which is a very effective way of looking into problems.
Another approach is to employ what’s called structured logging, which we used at an insurance company I spent some time with. Instead of logging something like:
There was an invalidInputFormat error capturing data for user 54321
You could log:
There was an error capturing data for userId={54321},
errorType={invalidInputFormat}
By adding a little extra structure into your individual log entries, you make it possible to search for information more easily. There are some powerful tools available (e.g. Splunk) that can build indexes based on these kinds of logs and offer optimised search, aggregation and visualisations. If you’re using a tool like ElasticSearch, you can also log structured data in JSON format.
Logs may be used in more sophisticated ways now, but don’t forget to leverage the well-proven practice of specifying log levels, such as ERROR, WARN and INFO. Marking the severity of each log entry in this way is extremely helpful when supporting a system, because it improves the signal-to-noise ratio of your logs. Someone supporting a system should be able to look at a day’s worth of logs and be able to filter to only see errors (and ideally there shouldn't be too many of these). This way, they can ensure that nothing has gone wrong and unnoticed.
Metrics
In addition to logging information in log files, there are tools like statsd available that allow you to count system events and aggregate system data. Where logs are useful for gathering very specific information, this approach can complement logging by offering a way to gather aggregated information. At Tes, we’ve been using statsd to send data to DataDog. For example, we periodically send the current CPU load and memory usage of each of our Docker containers, so we can notice performance issues. Again, I’d like to stress that you consider capturing business metrics as well as technical ones.
For the job application system I mentioned earlier, we send metrics for common errors. In order to send emails, we send a message via a message queue to a shared microservice. If that service is unable to process the message, it ends up in a Dead Letter Queue and we send off a metric to indicate that one of our messages has entered that queue. If we receive any instances of this metric, the team is alerted that something is wrong and should be investigated. We can then search the logs for errors that occurred during the same time window in the email service to find out which job application did not get emailed to a school and what the error message was.
We also gather common usage metrics, such when an application is started, updated or submitted. We can use this to see what percentage of applications are submitted and lets us compare our different types of application forms. These statistics help us identify trends, learn about the system and respond to potential issues. It’s worth pointing out that tools like these are aimed at gathering enough data to provide useful statistics, so usually can’t be relied on for precision.
APIs
Don’t be put off if the above techniques seem onerous to start with. The simplest place to look for data about your systems is the APIs of tools you already use. Many performance monitoring, web analytics, uptime monitoring and IaaS tools provide APIs that can be queried to get data about how your system is performing and being used.
Learning from production data
Alerting
All the data you’ve gathered is useless if nobody reacts to it, so it’s important to set up some sort of alerting system. When issues crop up in production, you want to be the first to know, so that the impact on your users is minimal. You’ll need software that will monitor your log data or metrics with the capability of sending you alerts. These alerts might be delivered via email, text message or as a notification in a chat room your team uses. You’ll then need to set up some alert thresholds - rules for when you want to be notified. In the job application example, we get notified when we fail to send any emails to schools (i.e. a threshold of 1). This is because these kinds of errors should be rare and should be taken seriously when they occur. To see how often teachers abandon their applications, our alerting needs to be relative to other data. When the number of job applications in a day dips below a certain number, or diverges noticeably from the current trend, we get an alert to notify us that something may be stopping teachers from applying.
It’s important to point out that alerting is not just about letting you know that something has gone wrong. Good alerting will let you know before something goes wrong. The more you learn about your system, the better you’ll be at setting up the kind of monitoring that will indicate impending issues. For example, you may know that memory usage of more that 64% on a particular server often indicates that there is a memory leak and that it will run out of resources soon. If you are alerted in time, you can take steps to address the memory issue or bring a backup server online. A sophisticated setup may even include some self-healing mechanisms.
Having a good signal-to-noise ratio in your alerting is vital. If your team receives too many alerts, or alerts for too many false alarms, the alerts will become noise, be ignored and important issues will be missed.
Dashboards
Dashboards are a common way of making data more easily consumable. These usually comprise of a collection of graphs (e.g. of CPU usage across all servers) or big individual numbers (e.g. number of job applications today). The data for these visualisations could come from a variety of data sources, so the dashboarding tool you’re using may need to do some data processing or aggregation. Otherwise, you could use the built-in dashboards that many tools now provide. It’s useful to have these visualisations on a big screen in your team’s working area, so that you can see trends and status at a glance. If your team works remotely, then make sure the links to the dashboards are easy to find. Humans have a canny ability to spot trends and notice oddities so, if your team is used to looking at the data, you may find issues without having to invest in maintaining complex data-crunching algorithms.
It’s becoming increasingly common for organisations to make some basic system statistics available to their users in the form of status pages. This helps keep users informed of issues as they happen and reassure them that they are being addressed. See GitHub’s status page for an example or look at the one we provide at Tes.
A QA approach rooted in reality
When most people think of QA, they think of testing, but to have a good handle on the quality of a system it’s important to remember other aspects of QA. Learning about the system and analysing the biggest quality issues is an aspect that is often overlooked.
Tests can only help you with scenarios you already know about. Testing is great for finding defects you expect to happen, but many production defects are surprises. Users, networks, browsers and devices are hugely diverse and highly unpredictable. Tests simply cannot cover every scenario. Tests are a good way of making sure that a system behaves as intended, but they cannot tell you whether the intended behaviour is correct. Good production monitoring can provide valuable feedback about scenarios you hadn’t foreseen and help you adjust your system’s behaviour accordingly. QA is as much about learning the correct behaviour for a system as it is about safeguarding that behaviour - an aspect that is often overlooked.
Tests need to earn their keep
Testing is a valuable practice that saves many organisations an enormous amount of time and money, but it is worth considering that testing does have a cost. Some tests are easy to maintain and work with, but others take a lot more effort. UI or browser-based tests, for example, are known to be flaky (they produce lots of false failures), brittle (they require a lot of upkeep as the UI evolves) and often depend on unreliable downstream systems. For some organisations, especially those reliant on proprietary hardware or software, performance testing is expensive. Instead of having a UI test that checks whether some functionality works, you could have monitoring in place to ensure that critical metrics don’t dip below certain thresholds. Instead of having a suite of tests to place the functionality under simulated load, you could have metrics in production that indicate the average response time of your system.
The team can then carry on delivering valuable improvements to the site in the time they would have spent on these tests and will be notified if anything seems the matter with the system. If something does go wrong, they can investigate and remedy the failure.
Are you ready to adopt production QA practices?
The short answer is yes. Most teams will gain more insight into the system they are building by paying more attention to what is happening in production and should quickly see value in setting up some basic dashboards and alerts.
The problem with the short answer is that QA in Production includes the notion that you can swap out some of your pre-production quality practices for the techniques described in this article. In practice, it can be difficult to support this kind of shift without some enabling Continuous Delivery practices in place.
Before replacing some conventional pre-production QA techniques, you should build a culture of testing and the associated testing skills. As you attempt to fix issues you find in production, it's important to have a solid set of automated tests to give you confidence that you haven’t broken something else. Without the right kinds of tests in place, you risk playing an endless game of Whack-A-Mole.
Relying on production data to identify issues means that fixing these issues is very time-sensitive. Once you’ve resolved the issue or put a workaround in place, you need to be able to take that change to production quickly. You need to have automated deployments in place in order to do this, otherwise you risk manual errors that could make things much worse.
Finding the right balance
Replacing expensive tests with monitoring can allow an organisation to move faster, but each organisation will need to find its own balance between this speed and being sure (or as sure as one can be) that things work before releasing to production. This balance will depend a lot on the system in question. The Facebook development team1, for example, is able to forego some testing because they have good feedback loops to let them know if they’ve broken something in production and they can release fixes quickly. If something goes wrong and someone is unable to view a photo or misses a friend’s birthday, it’s not the end of the world. At the other extreme, a company programming medical devices has high stakes and a very slow feedback loop, so they need to be as sure as possible that things work before these devices are used. Most systems lie somewhere in between.
1: Facebook used to have the motto “Move Fast and Break Things”. See this xkcd cartoon for an idea of why this isn't the right approach for everyone.
For any system, there will be issues that are difficult to recover from. For these instances, you’ll need to invest more in pre-production testing to prevent mishaps in production. Every issue that happens in production will have an associated cost, so it’s important to decide how cautious you need to be. The nice thing about waiting until an issue occurs in production is that you know it's worth fixing, because it really happened.
Some organisations already do all of their testing in production, but relying entirely on issues or testing in production for an understanding of the quality of your system is an Anti Pattern. It misses the point that proper QA requires a variety of quality practices, of which QA in Production is just one. If all you're looking for is a point in your process to say “yes, that looks fine,” you will not learn very much about how to make your system better.
Finding the right balance of pre-production and production quality practices can help you gain a more realistic and holistic understanding of the quality of your system. The most important thing to remember is that we can learn a lot by paying close attention to what is happening in production, and that we can use what we learn to build something of better quality.
Footnotes
1: Facebook used to have the motto “Move Fast and Break Things”. See this xkcd cartoon for an idea of why this isn't the right approach for everyone.
Significant Revisions
04 April 2017: First published